
Fig. 1.
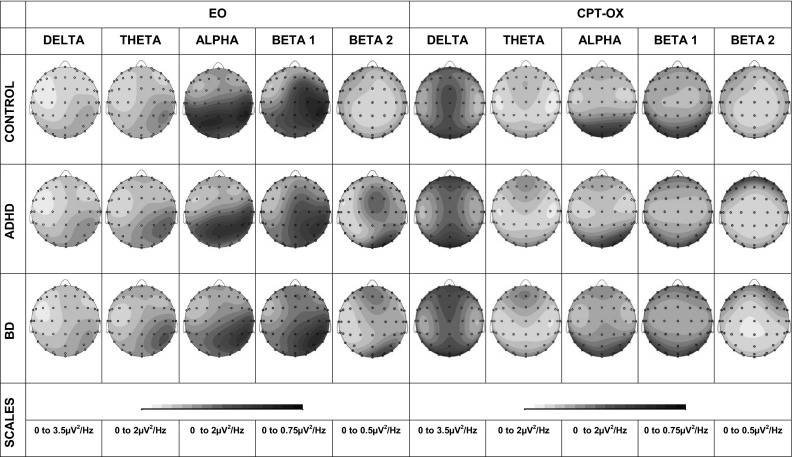
Topographic maps showing scalp recorded power density in absolute delta, theta, alpha, beta 1 and beta 2 bands for resting-state (EO) and CPT-OX conditions
Official websites use .gov
A
.gov website belongs to an official
government organization in the United States.
Secure .gov websites use HTTPS
A lock (
) or https:// means you've safely
connected to the .gov website. Share sensitive
information only on official, secure websites.
Topographic maps showing scalp recorded power density in absolute delta, theta, alpha, beta 1 and beta 2 bands for resting-state (EO) and CPT-OX conditions