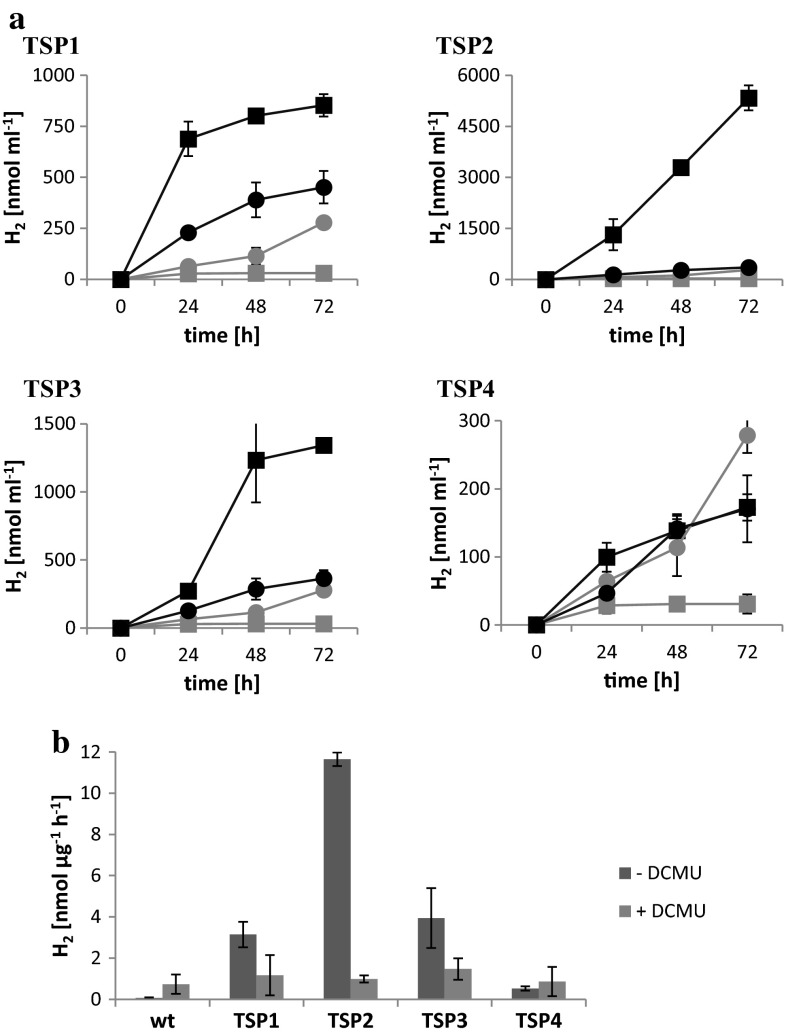
Fig. 4.
Hydrogen production in the light at 37 °C. a Hydrogen accumulation in sealed flasks per ml culture over 3 days. In all charts, the gray curves correspond to the wild type; the black curves correspond to TSP1, TSP2, TSP3, and TSP4, as indicated. The squares and circles represent cultures without and with DCMU, respectively. b Average hydrogen production rates during the most productive day. The values were normalized to chlorophyll content. The dark and light bars represent cultures without and with DCMU, respectively. All cultures were grown at 25 °C, incubated for 1 day at 37 °C, and then transferred to sealed bottles without and with 10 mM DCMU. The light intensity was 60–70 μE m−2 s−1 during growth and incubation at 37 °C. Data represent the mean ± SD of four independent experiments

