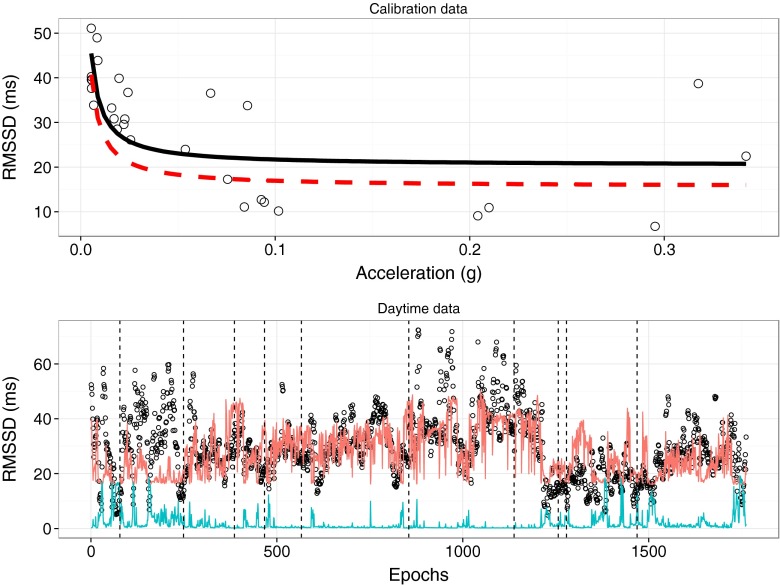
Fig. 1.
Calibration and daytime data for one participant. In the upper panel, the relation between acceleration and RMSSD is depicted. The solid black line represents the predicted inverse relation between acceleration and RMSSD, whereas the dashed red line depicts the derived threshold for detecting AddHRVr (i.e., predicted RMSSD levels − 2 × SE). In the lower panel, the data for the daytime assessments (per 30 s epoch) are shown (scatter; all data points depicted in open dots). The red line indicates the continuously calculated threshold, and the open dots below this line are epochs with AddHRVr decreases. For illustrative purposes, acceleration (multiplied by 50) is also included as the blue line. The dashed black lines indicate where hourly AddHRVr periods were detected (i.e., a 7.5 min of AddHRVr precedes this line)

