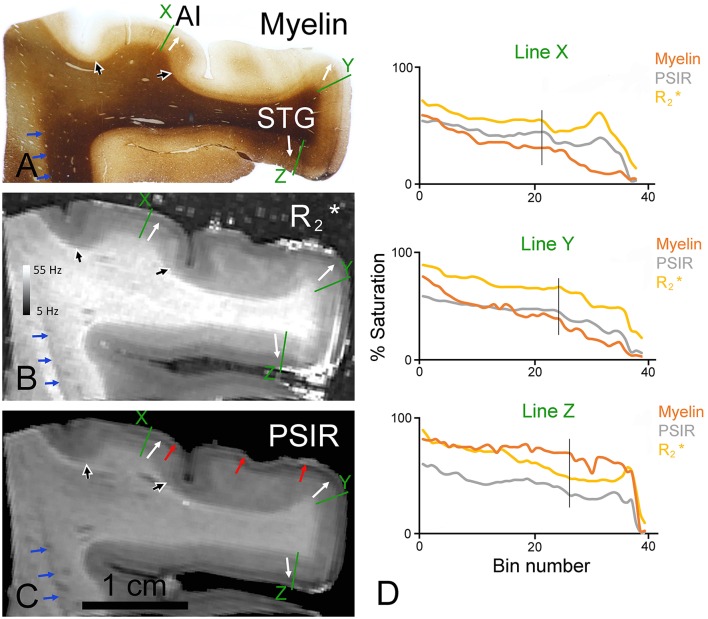
Figure 3.
Coronal sections through the ventral bank of the lateral fissure stained for myelin (A) or viewed as quantitative (B) or PSIR images (C). The junction between the deep layers (4–6) with their greater density of myelinated fibers and the superficial layers (1–3) with their low density of myelinated fibers is indicated by white arrows in the primary auditory cortex (AI) and the superior temporal gyrus (STG) of all three images. The borders of AI are indicated by the large black/white arrowheads in all three images. The border between the bright band in layer I and the dark band in the layer II observed most clearly in PSIR images is marked by red arrows. The edge of a narrow dark band along the margin of the white/gray matter boundary at the edge of the insula is indicated by the blue arrows. The densitometric profiles across the green lines are plotted in (D) for the myelin and the two MR images with bin 1 being in the white matter and bin 36 close to the surface. The vertical black line in the graphs indicates the position of the 3/4 border in the myelin staining.

