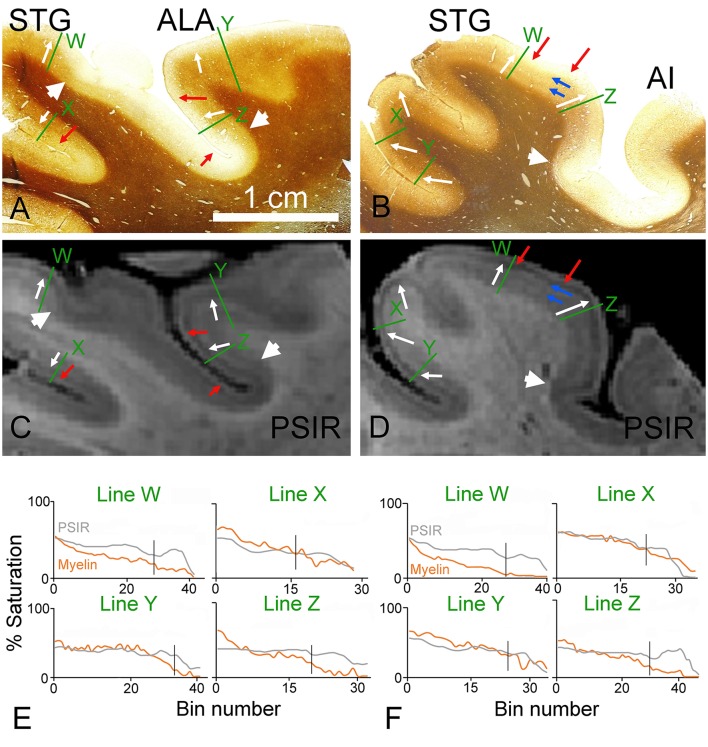
Figure 4.
Coronal sections through the ventral bank of the lateral fissure stained for myelin (A,B) or viewed as PSIR images (C,D). The sections in (A,C) cut through the area that is anterior and lateral (ALA) to the primary auditory part of the first transverse (Heschl's) gyrus as well as the superior temporal gyrus (STG). The sections in (B,D) are from further posterior on the STG. The junction between the well-myelinated deep layers (4–6) and the pale superficial layers is marked by white arrows. The borders between myeloarchitectonic areas are indicated by the large white arrowheads in the myelin sections and the corresponding density changes are also indicated in the PSIR images. The junction between the bright outermost band (layer I) and the dark band in layer II of the PSIR images is marked by red arrows and the corresponding points are indicated in the myelin sections. The blue arrows mark the faint inner and outer bands of Baillarger in the myelin staining of section (B) and the PSIR image of (D). The densitometric profiles across the green lines are plotted in (E,F) for the myelin and PSIR images above them. The vertical black line in the graphs indicates the position of the 3/4 border in the myelin staining.

