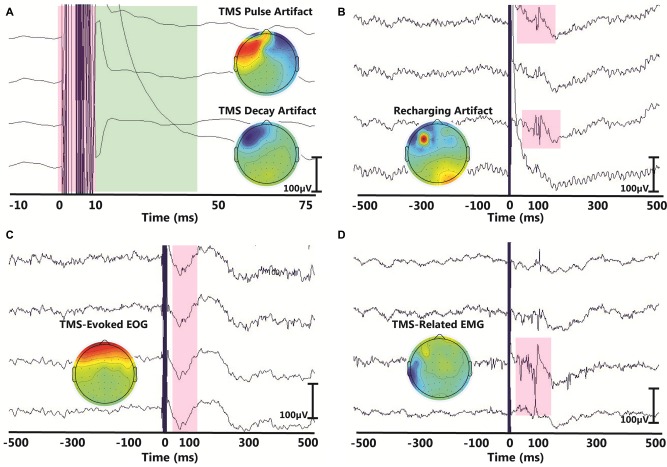
Figure 1.
Examples of common artifacts in transcranial magnetic stimulation-electroencephalography (TMS-EEG) data. In each panel, the x-axis represents time in the millisecond range and y-axis represents the amplitude of the EEG signal in the microvolt range. Topographical maps in each panel illustrate the scalp projection of each corresponding artifact. The displayed artifacts are: (A) the large-amplitude TMS pulse artifact (red) with the associated TMS decay artifact (green), (B) recharging artifact, (C) TMS-evoked eye blink artifact and (D) TMS-related muscle artifact.

