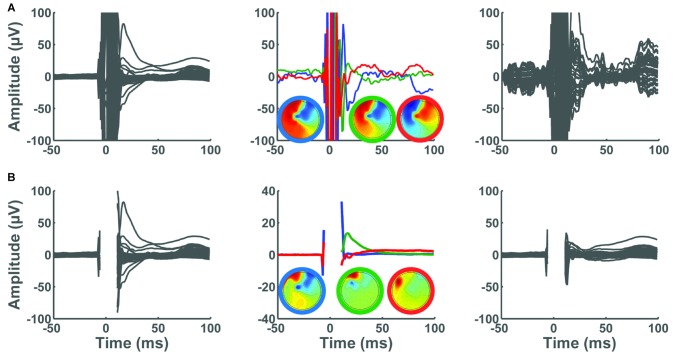
Figure 11.
Consequence of removing the large-amplitude TMS pulse artifact on the performance of ICA. In all panels, x-axes represent time in milliseconds relative to presentation of TMS pulse and y-axes represent the amplitude of the EEG signal in μV. The left panels show the average butterfly plot of the TEPs, depicting mean TEP (averaged across trials) for each channel before removing ICA components. The center panels depict the three largest ICA components identified in Step 4. In these panels, the three topographical maps are color coded to match their corresponding ICA components in the time domain. The right panels illustrate the average TEP after removing the three ICA components. (A) TMS pulse artifact was not deleted in Step 2. The ICA was not able to remove the decay artifact. (B) TMS pulse artifact was cut by removing a data segment between −5 ms to 10 ms. The TMS decay components were successfully removed using ICA.

