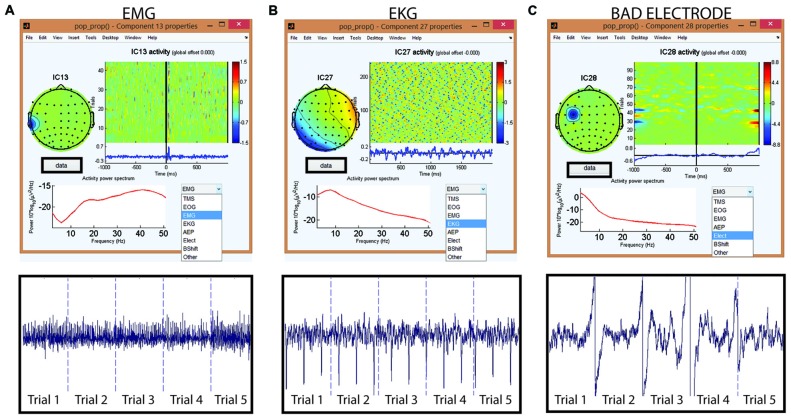
Figure 13.
Tagging artifactual ICA components through TMSEEG toolbox. The top row displays the TMSEEG GUI for classification of ICA components and the visualization of the spatial, temporal and spectral properties of three ICA components (A–C). In each window, the spatial characteristics of the component is displayed on the top left corner (topographical plot), the magnitude of the component across trials is displayed in the top right corner (x-axis represents time in milliseconds relative to TMS pulse and y-axis represents trials), and the frequency spectrum of the component is displayed in the bottom left corner (x-axis represents frequency in Hertz and y-axis represents the power spectral density). The drop-down menu on the bottom-right allows for a convenient classification of the artifact type. The second row depicts the ICA components in the time-domain over five continuous trials. The user can access this time-domain depiction of components through the “Data” button embedded in the GUI. The displayed artifacts are: (A) muscle artifact (electromyography [EMG]) in the left panel, (B) cardiac artifact (electrocardiographic [EKG]) in the middle panel, and (C) bad electrode artifact in the right panel.

