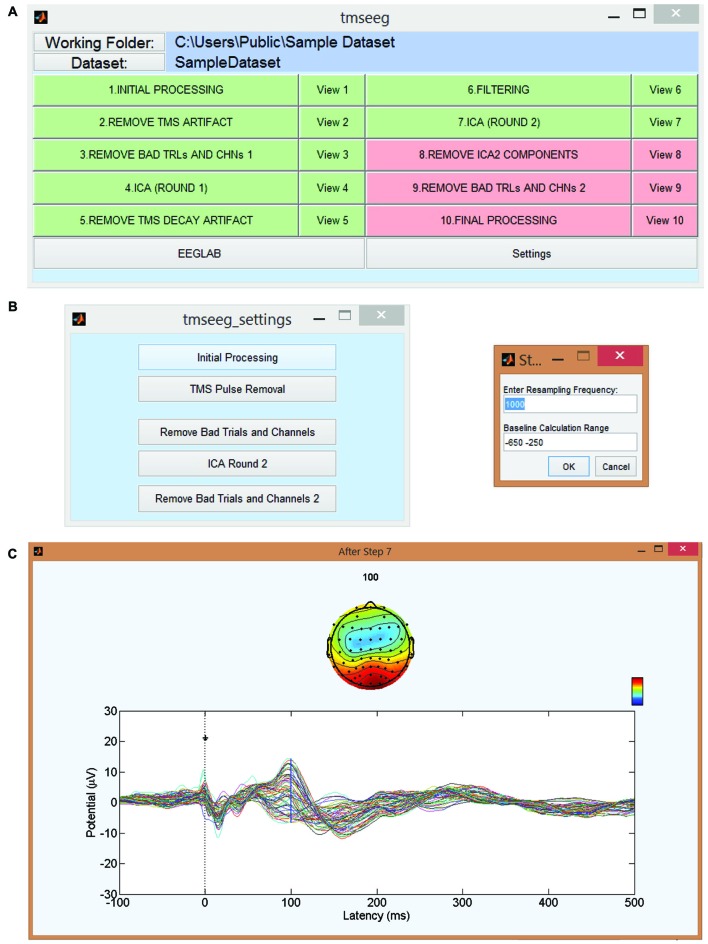
Figure 2.
TMSEEG main graphical user interface (GUI). (A) TMSEEG main GUI window comprised of a button for TMS-EEG file selection, 10 data processing buttons, 10 data View buttons, and two buttons for access to the Settings menu and EEGLAB toolbox. Data processing buttons are coded in red if a step is yet to be processed and changed to green at the completion of a step. (B) Users can change the default settings of any processing step in the corresponding Settings window. (C) Selecting the “View #” button next to a processing step will display the average butterfly plot illustrating TMS-evoked potentials (TEP)s at the completion of that step for a quality control check. X-axes represent time in milliseconds relative to presentation of TMS pulse and y-axes represent the amplitude of the EEG signal in μV.

