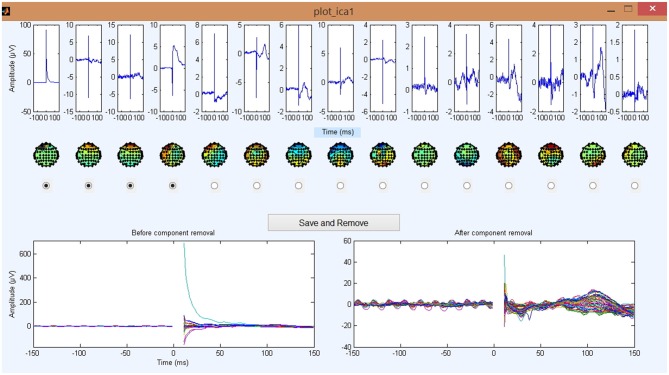
Figure 6.
Step 5 GUI for removing the TMS decay artifact. The plots in the top row are the 15 largest independent component analysis (ICA) components averaged across trials and sorted by component variance. Corresponding scalp plots are shown below. The bottom left butterfly plot displays the EEG data averaged over all trials before the removal of any ICA components (each colored line presents a channel). The bottom right butterfly plot shows the updated EEG data averaged over all trials after the deletion of tagged ICA components. Note the drastic change in the amplitude of the y-axis from the left panel (1000 μV) to the right panel (100 μV) and the unmasking of smaller evoked signals. For all waveform plots, x-axis represents time in milliseconds relative to presentation of TMS pulse and y-axis represents the amplitude of the EEG signal in μV.

