Figure 3.
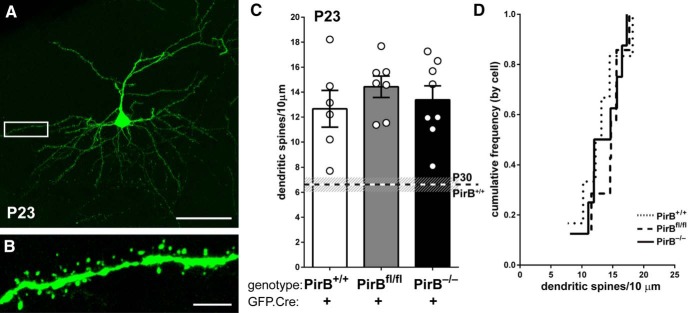
At P23, dendritic spine density on L2/3 pyramidal cells in PirB−/− visual cortex is similar to that of PirB+/+. A, Fluorescent micrograph at P23, an age near the onset of spine pruning, showing an isolated L2/3 pyramidal neuron electroporated with GFP.Cre at E15.5. B, High-magnification, maximum-intensity projection of boxed area in A showing spines on basal dendrites of GFP+;Cre+ L2/3 neuron. C, Basal dendrite spine density is higher in PirB+/+ neurons at P23 than in PirB+/+ neurons at P30 (P30 data indicated by dotted line; data from Fig. 2H); spine density from P23 PirB+/+ is not different from PirBfl/fl or PirB−/− neurons (P23 PirB+/+: 12.66 ± 1.5, n = 6 cells, 3 mice; P23 PirBfl/fl: 14.43 ± 0.9, n = 7 cells, 5 mice; P23 PirB−/−: 13.39 ± 1.1, n = 8 cells, 4 mice; P23 PirB+/+vs P23 PirB−/−, p = 1.000g; P23 PirB+/+ vs P23 PirBfl/fl, p = 0.924g; P23 PirBfl/fl vs PirB−/−, p = 1.000g, one-way ANOVA with post hoc Bonferroni’s multiple comparisons; P23 PirB+/+ vs P30 PirB+/+, p = 0.004g; P23 PirBfl/fl vs P30 PirBfl/fl, p = 0.19g; P23 PirB−/− vs P30 PirB−/−, p = 1.00g, one-way ANOVA with post hoc Bonferroni’s multiple comparisons). D, Cumulative histogram (by cell) of data presented in C. Scale bars: A, 50 μm; B, 5 μm.

