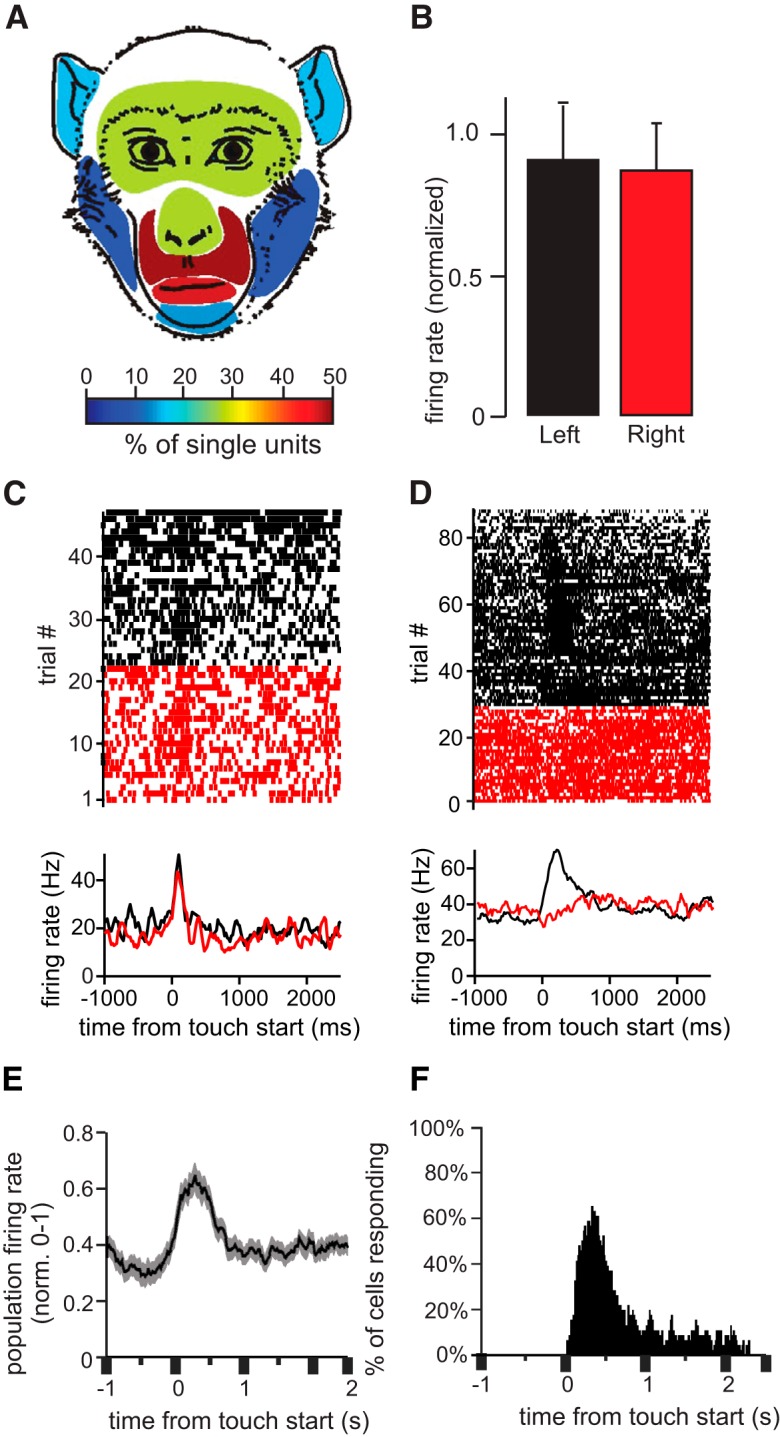
Figure 2.

Population activity and bilateral receptive fields. A, The colors in this illustration indicate the proportion of cells that responded to tactile stimulation on each facial region. Note that these values add up to more than 100% because the majority of cells responded to the touch of multiple facial regions. B, Mean normalized firing rate of the population of tactile cells during stimulation of the left and right sides of the face (no significant difference, α = 0.05). C, D, Example neurons with bilateral (C) and unilateral (D) receptive fields. Rasters (top) and PSTHs (bottom) indicate the firing rate of the two neurons before and after tactile stimulation (zero on the x axis corresponds to the onset of stimulation). Trials shown in black and red correspond to stimulation of the left and right face, respectively. E, Mean normalized population firing rate of all tactile cells. F, Histogram showing the number of tactile cells that responded with a significant change in firing rate at each time bin following stimulation (bin size = 100 ms with 20-ms sliding window). Tactile cells modulate their firing rate throughout stimulation. The time bin at which the highest number of cells responded was 270–370 ms after stimulation onset.
