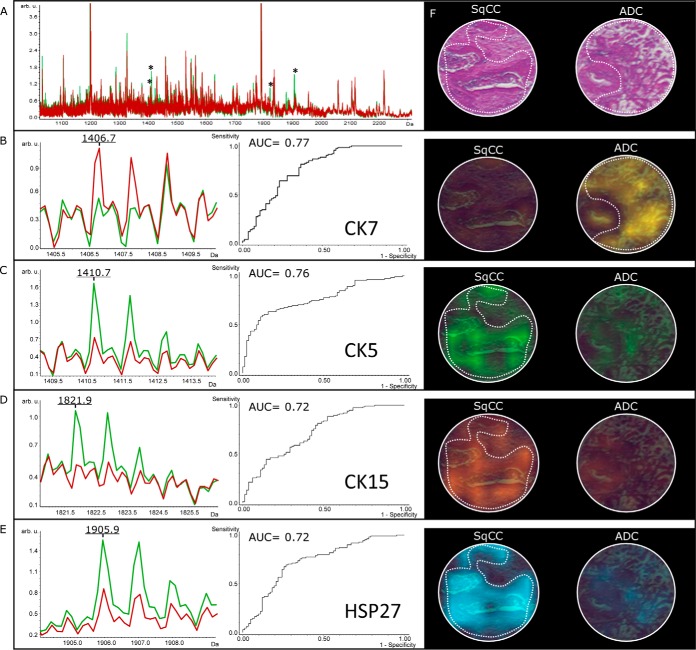
Fig. 2.
MALDI imaging: a, A full average spectrum of SqCC (green) and ADC (red) with a significantly different peptide pattern (asterisk) is shown. b, A peptide average profile of CK7 (m/z 1406.7) with high expression in ADC, but low expression in SqCC is depicted. c–e, Likewise average peptide profiles of CK5, CK15 and HSP27 with high expression in SqCC, but low expression in ADC are demonstrated. f, H&E and corresponding color encoded MALDI images of the mentioned peptide-ions show the distribution in tumor areas from SqCC and ADC (dashed line).

