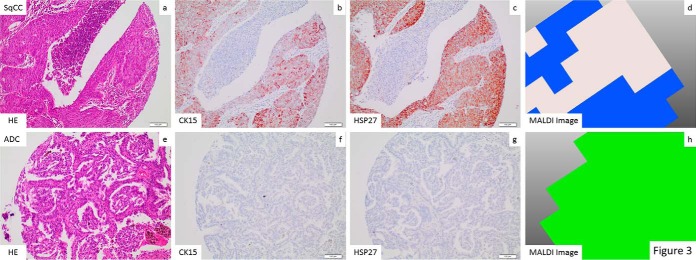
Fig. 3.
Correlation between H&E, IHC, and MALDI imaging: An excellent correlation between the identification of tumor areas by morphology H&E stained tissue slides, (a, e), CK15 IHC (b, f), HSP27 IHC (c, g) and imaging classification (d, h) is seen in an exemplary SqCC (a–d) and ADC (e–h). Histological assignment from MALDI is shown in a color-encoded visualization: Blue was assigned to SqCC and green to ADC.

