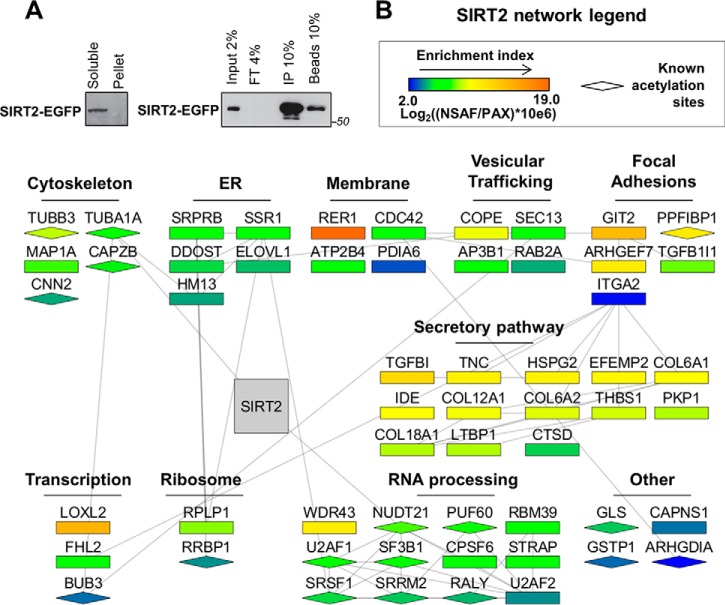
Fig. 2.
SIRT2 interaction network in human fibroblasts. A, Isolation efficiency of SIRT2-EGFP from IP with optimized conditions. SIRT2-EGFP IP was performed from MRC5 cells with optimized lysis buffer using anti-GFP antibody conjugated to magnetic beads via epoxy group. Efficiency of isolation was demonstrated by Western blotting using anti-GFP antibody for detection of SIRT2-EGFP. Soluble - soluble fraction after lysis, Pellet - insoluble fraction, Input - IP input, FT - IP flow through, IP - IP elution, Beads - IP beads fraction after elution. B, Network of SIRT2-interacting partners. Interacting proteins were identified by nLC-MS/MS analysis of SIRT2-EGFP and EGFP control IPs as in Fig. 1F. SAINT algorithm was used to calculate specificity scores based on the number of spectral counts for each protein identified. Proteins passing a SAINT cut-off score of 0.8 were included in the network generated from string-db.com and Cytoscape software. Each node represents an interacting protein, where node color indicates protein enrichment in isolated fraction (NSAF) over its relative enrichment in the human proteome (PAX). Node shape indicates whether the protein is known to be acetylated (diamond) based on uniprot.org records. Protein clusters were assigned based on their known intracellular localizations and functions.

