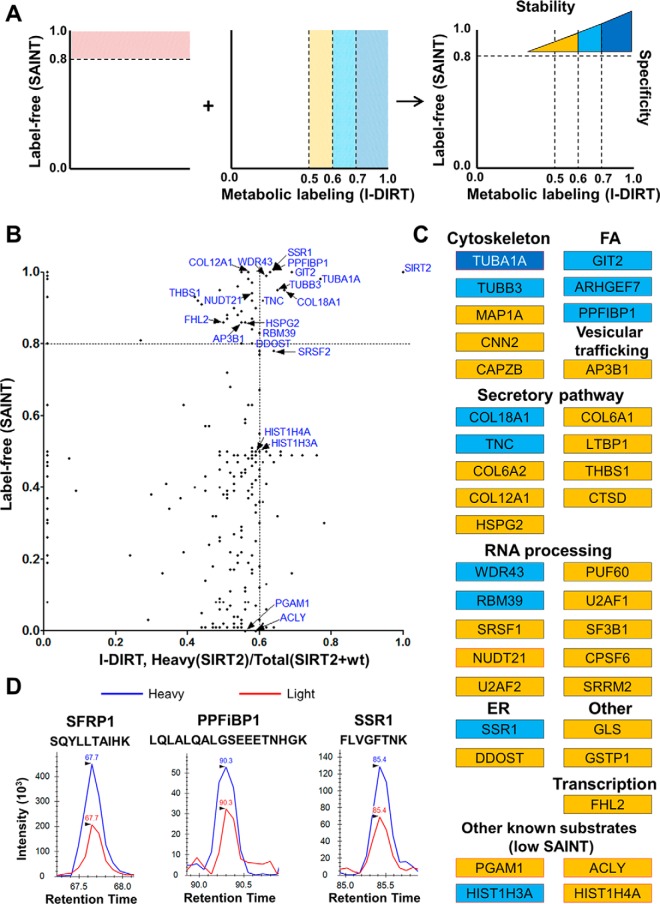
Fig. 3.
Analysis of the relative stability of SIRT2 interactions. A, Combination of label-free and metabolic labeling MS-based approaches provides information on specificity and relative stability of SIRT2 interactions in human fibroblasts. B, Comparison of I-DIRT and SAINT scores from SIRT2-EGFP IP experiments. For the I-DIRT-based experiment, SIRT2-EGFP IP was performed upon mixing of MRC5 wt and MRC5 SIRT2-EGFP labeled light (Arg0, Lys0) and heavy (Arg6, Lys6), respectively. I-DIRT scores were calculated as a heavy/(heavy+light) ratio based on precursor peak intensity areas. Each dot represents an interacting protein identified in both experimental approaches. C, Table of interactions identified in SAINT and I-DIRT experiments color-coded based on I-DIRT ratio, as indicated in A. All shown interactions passed SAINT specificity score cutoff unless specified otherwise. Red outline indicates known SIRT2 substrates. D, Representative I-DIRT precursor peak intensity profiles for selected interacting proteins (SFRP1, PPFiBP1, SSR1).

