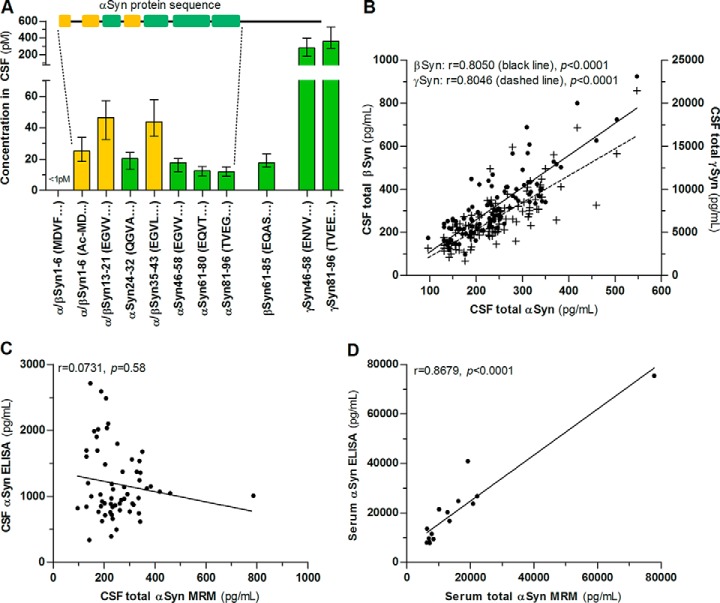
Fig. 2.
Synuclein peptide pattern in CSF and comparison with ELISA. A, Concentration of tryptic synuclein peptides in CSF of control patients measured by MRM. Green indicates proteotypic peptides and yellow are peptides common to αSyn and βSyn. The αSyn protein sequence is shown to visualize the position of αSyn peptides. B, Synuclein concentrations in CSF show a strong correlation with each other (black dots: βSyn, n = 113, crosses: γSyn, n = 116). The concentration of total αSyn in (C) CSF (n = 60) and (D) serum (n = 15) was determined by MRM and a commercially available ELISA. Columns and bars are median and interquartile range. Correlation was calculated using linear regression analysis and Spearman′s rank correlation coefficient.

