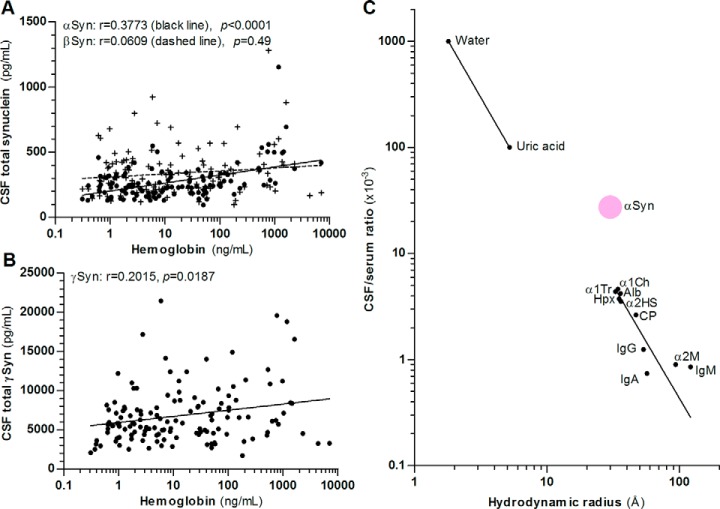
Fig. 3.
Correlation of synucleins with hemoglobin and estimation of blood-derived αSyn in CSF. A, CSF βSyn concentration (crosses, n = 133) does not correlate with CSF hemoglobin concentration but αSyn (black dots, n = 123) and (B) γSyn (n = 136) show a correlation. Correlation was calculated using nonlinear regression analysis and Spearman′s rank correlation coefficient. C, Correlation of hydrodynamic radii and CSF/serum concentration ratio of serum compounds passively transferred into CSF according to Felgenhauer (25, 71) and of αSyn (mean MRM value from control patients with an albumin CSF/serum quotient <5, n = 5). Correlation of passively transferred serum compounds was calculated using nonlinear regression analysis and the blood-derived portion of αSyn in CSF was calculated using the received equation no. 1: Y = 10(m * logX + b) with m = −2.132, X = hydrodynamic radius αSyn (29.9Å), b = 3.896. Alb: serum albumin, α1Ch: α1-antichymotrypsin, α1Tr: α1-antitrypsin, α2HS: α2-HS-glycoprotein, α2M: α2-macroglobulin, CP: ceruloplasmin, Hpx: hemopexin, Ig: immunoglobulin.

