Fig. 1.
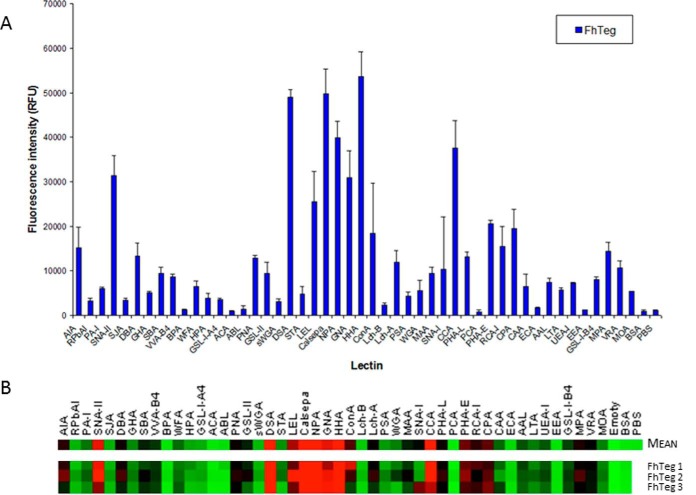
Lectin microarray reveals that Fasciola hepatica tegument (FhTeg) exhibits a rich and complex oligosaccharide make up. Fluorescently labeled FhTeg (8.6 μg ml−1) was incubated with a proprietary lectin microarray (1 h, 23 °C, 4 rpm) in TBS-T supplemented with 1 mm Ca2+ and Mg2+. Slides were scanned in a microarray scanner using a 543 nm laser. Histogram represents the the mean fluorescence intensity of three experimental replicates (18 data points in total) of fluorescently labeled FhTeg binding to printed lectins. Error bars are the standard deviation of the mean of three experimental replicates (A). Binding data is also represented as a heat map and depicts both mean intensity and individual replicates (B) in which little to no binding intensity is represented by green and greatest intensity by red.

