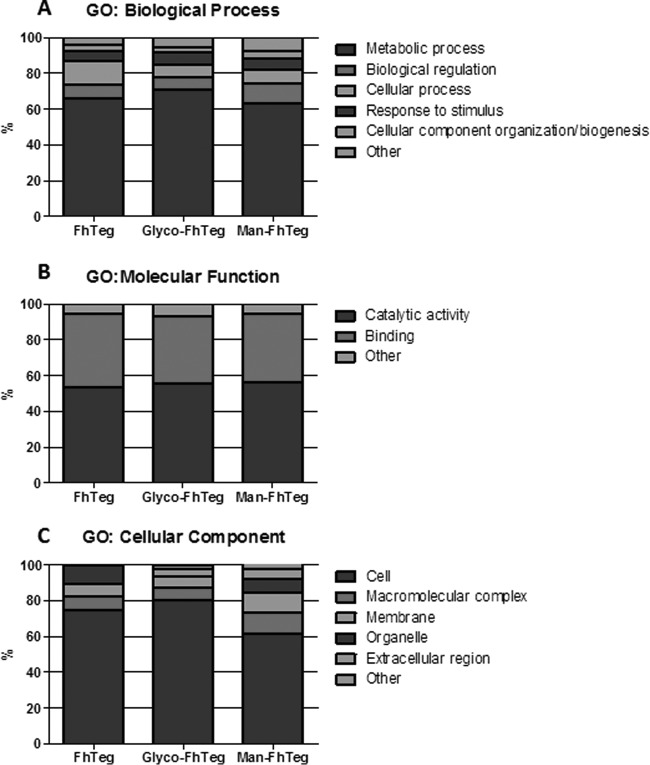
Fig. 6.
Comparative Gene Ontology analysis of the protein components of FhTeg, Glyco-FhTeg and Man-FhTeg preparations. Stacked column charts show the percentage distribution of proteins identified in FhTEg, GlycoFhTeg and Man-FhTeg fractions classified by Biological Process, Molecular Function and Cellular Compartment.

