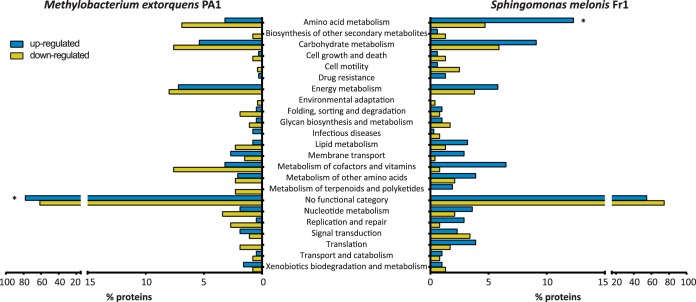
Fig. 5.
Proteome comparison of M. extorquens PA1 and S. melonis Fr1. KO term assignments of all differentially regulated proteins of M. extorquens PA1 and S. melonis Fr1 and their functional categories based on the KEGG Brite database. Blue and yellow bars represent the percentage of up and down-regulated proteins, respectively for each functional category. Asterisks indicate significant enrichments (p ≤ 0.05; Hypergeometric test, Benjamini-Hochberg FDR correction) of up- or down-regulated proteins of each functional category.

