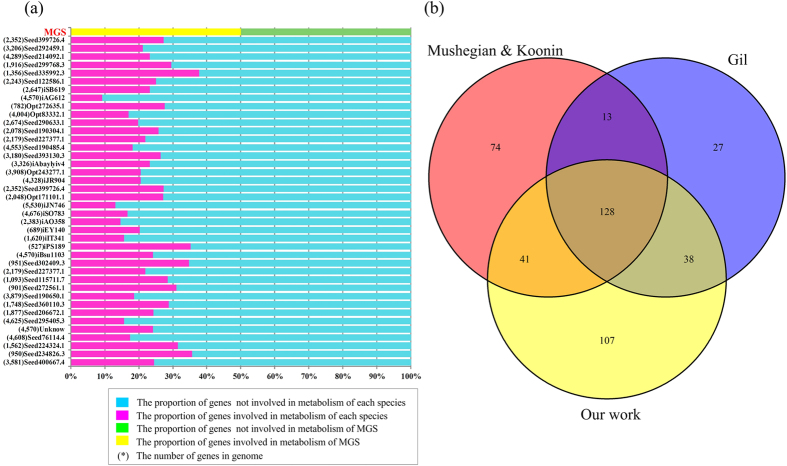
Figure 1. Comparison of the genes in our MGS and others.
(a). The distribution of genes involved in the metabolism of each species and in the minimal gene set. (b) A Venn diagram for the three MGSs showing that our MGS contains 91% of the genes (128 of 141) existing in both Koonin et al.’s and Gil et al.’s MGSs, as well as our 107 newly identified genes (underlined in Supplementary Table S2).

