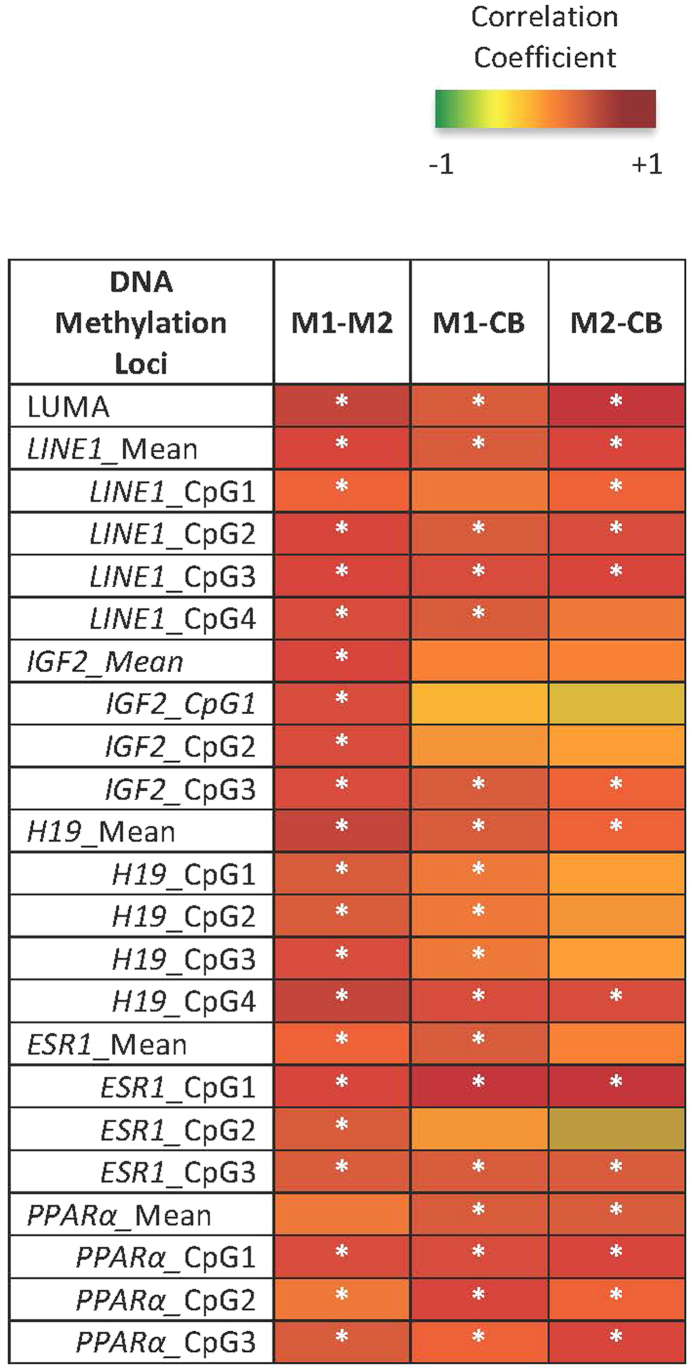
Figure 3. Correlations between Maternal DNA Methylation at M1 and M2 and Infant Delivery Cord Blood (CB) Methylation.
Pearson’s Correlations were performed on global (LUMA, LINE1) and candidate gene (IGF2, H19, ESR1, and PPAR alpha) methylation data and plotted into a heatmap. The darker red boxes indicate a larger positive correlation coefficient, smaller and negative coefficients are yellow to green. Significant correlations (p < 0.05) are denoted with a white asterisk.

