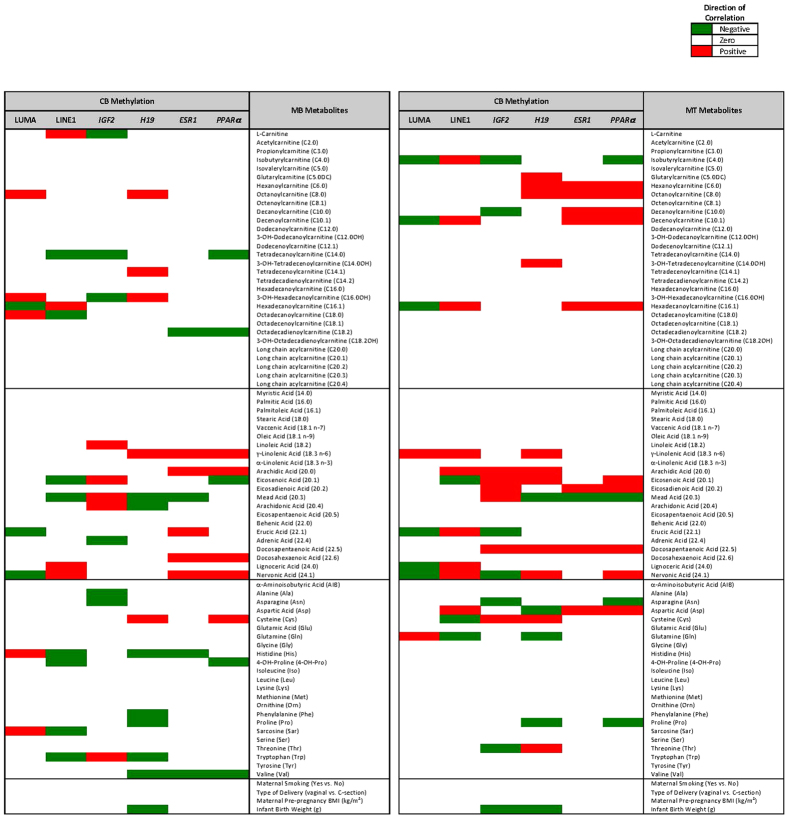
Figure 4. Multivariate Regression Analyses Illustrating the Maternal Metabolites Associated with Cord Blood DNA Methylation.
Multivariate regression was used to investigate the joint associations between all metabolites and mean DNA methylation, adjusting for confounders: maternal smoking, maternal prepregnancy BMI, delivery mode, and infant birth weight. M1 and M2 metabolites that were significantly associated with global or candidate gene loci are plotted in the heatmap. Negative associations are denoted in blue, positive associations in red.

