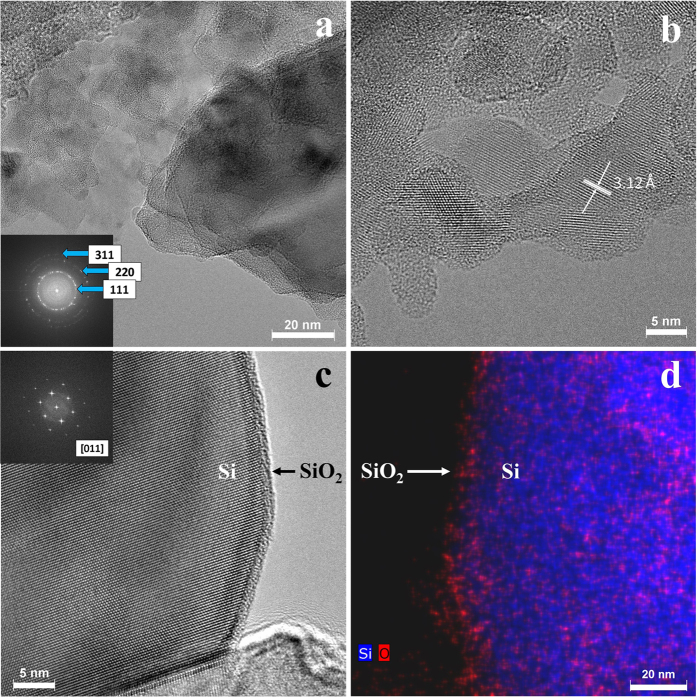
Figure 3.
HRTEM analysis of bare DE-derived nanoSi, including Si crystals of various orientations and the indexed selected area electron diffraction pattern as an inset (a), select nanoSi particles showing the d-spacing of crystalline Si (b), a select larger Si particle with well-distinguished Si core and amorphous surface layer with FFT inset (c) and a similar larger particle analyzed by dark-field EDX mapping showing the Si core and oxide surface layer (d).

