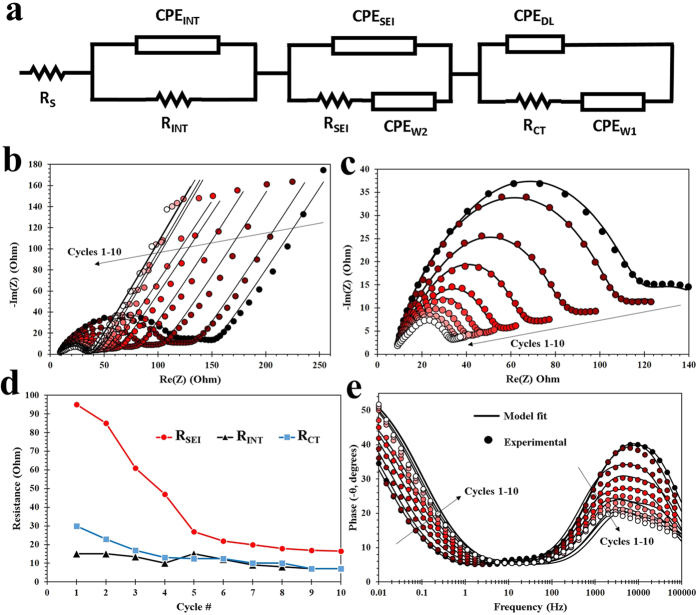
Figure 6.
EIS analysis of the DE-derived nanoSi electrodes assembled in a Li-ion half cell, including the EEC based on modeled EIS data (a), standard Nyquist plots for 10 cycles including fitted data (b), enlarged semi-circle/high-frequency region of the Nyquist plots (c), SEI resistance, internal impedance and charge transfer resistance data for 10 cycles (d), and Bode plots for 10 cycles including fitted data (e).

