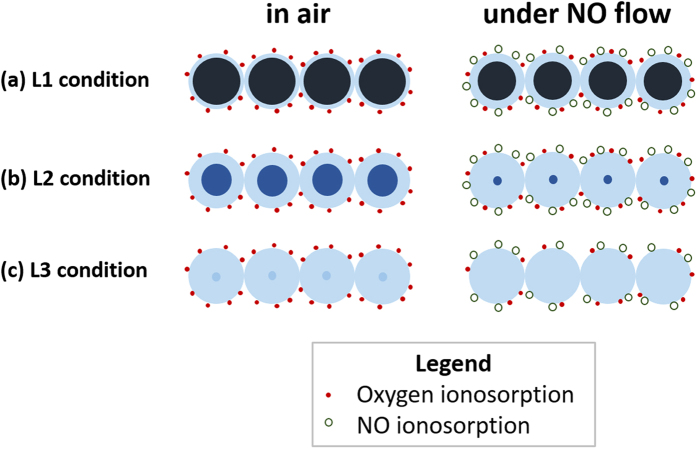
Figure 6. Schematic representation of the outer depletion region and inner conduction region in the connected particles of the sensor.
(a–c) reflect the L1, L2, and L3 (and L4) conditions, respectively, of the different light intensity conditions in air and under a NO flow. The solid circles represent oxygen, and the open circles represent NO molecules adsorbed.

