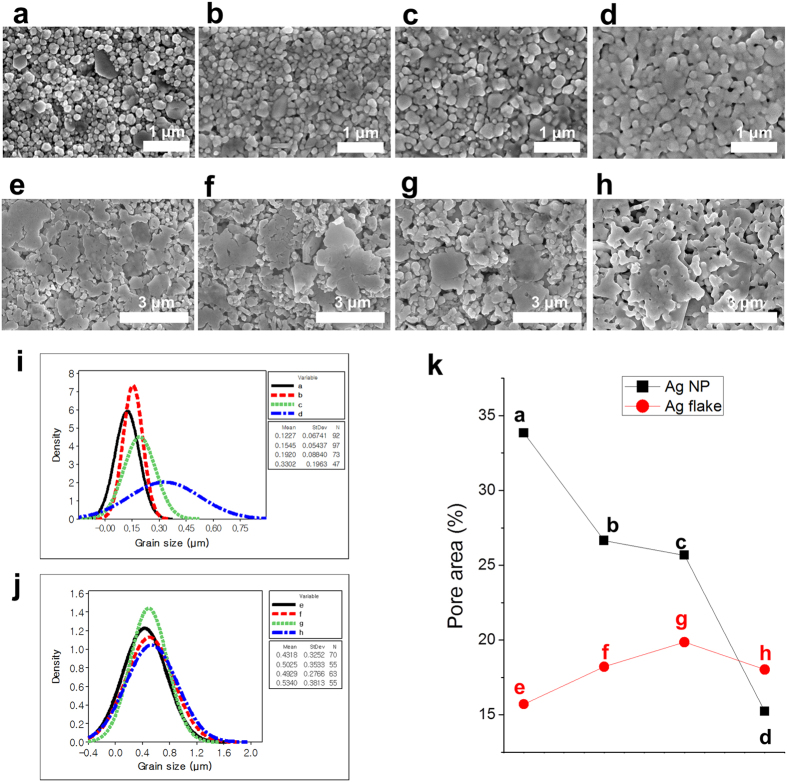
Figure 4.
SEM images of the printed and sintered layers of the (a–d) Ag NP and (e–h)Ag flake. (a) Hot air using Ag NP sample at 100 °C temperature and 60-s sintering time and IR-sintered layer with the following distances, IR lamp powers, and sintering times: (b) 50 mm, 500 W, and 1.08 s, respectively; (c) 50 mm, 500 W, and 5.4 s, respectively; and (d) 20 mm, 1000 W, and 1.08 s. respectively. (e) Hot-air-dried Ag flake layer at 100 °C temperature and 60-s sintering time and IR-sintered layer with distances, IR lamp powers, and sintering times of (f) 70 mm, 500 W, and 1.08 s, respectively; (g) 20 mm, 500 W, and 1.08 s, respectively; and (h) 20 mm, 1,000 W, and 10.8 s. Particle size calculation and fitted distribution of this histogram for (i) Ag NP and (j) Ag flake. (k) Pore area calculation based on image processing and graph of the pore area percentage as increments in the sintering conditions.

