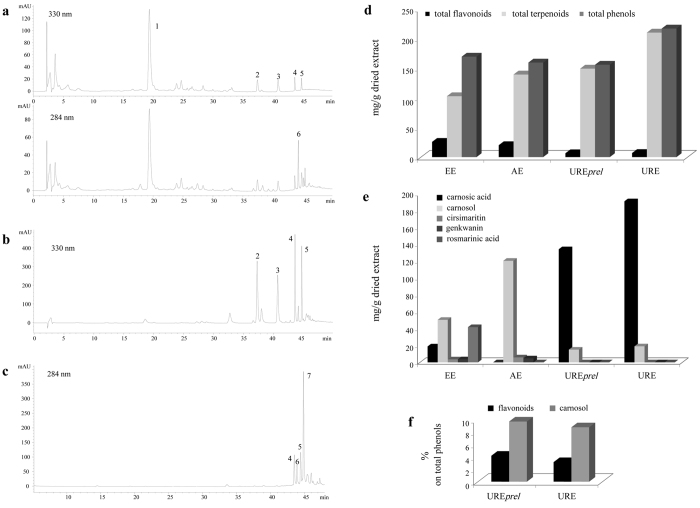
Figure 1. Extracts characterization.
HPLC profiles of (a) EE at 330 e 284 nm, (b) AE at 330 nm and (c) URE at 284 nm. 1, rosmarinic acid, 2, cirsimaritin; 3, genkwanin; 4–5, unknown flavonoids; 6, carnosol; 7, carnosic acid. Phenolic distribution in rosemary extracts. (d) Comparison among the total contents in flavonoid, terpenoids and total phenols in EE, AE, UREprel and URE. (e) Quantitative determination of rosmarinic acid and main flavonoid and terpenoid components. (f) Percentage of flavonoids and carnosol with respect to total phenols in UREprel and URE.

