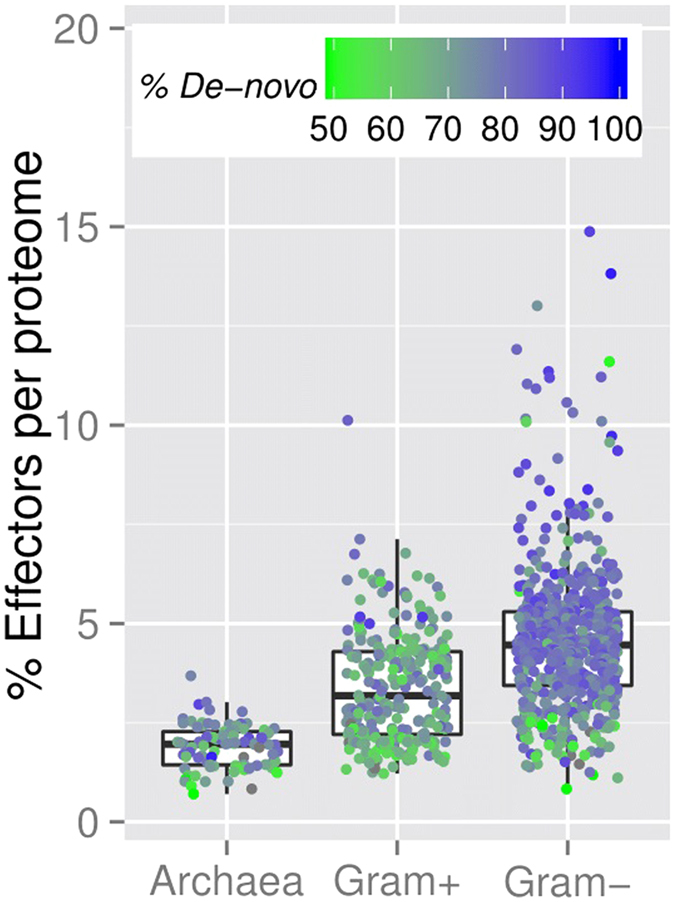
Figure 2. Percentage of predicted effectors in full proteomes.

The figure shows the box-plot-and-instance representation of percentages of pEffect-predicted type III effectors (Y-axis) in 90 archaeal, 274 Gram-positive and 588 Gram-negative bacterial organisms (X-axis), which are shown as dots. At least 50% of effector predictions in all, except 11 organisms in our set were predicted de novo. In the figure, the colour represents the percentage of de novo predictions for each organism: from green (50% de novo, 50% PSI-BLAST) to blue (100% de novo, 0% PSI-BLAST). While effectors predicted in archaea and Gram-positive bacteria are often picked up by PSI-BLAST, effectors in Gram-negative bacteria are mostly de novo predictions (mostly blue dots).
