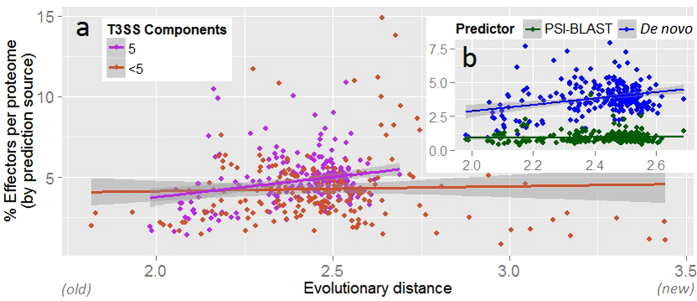
Figure 4. pEffect’s whole proteome predictions in Gram-negative bacteria.
(a) pEffect predicted type III effector proteins in the proteomes of 294 Gram-negative bacteria. The proteomes are shown as red and purple dots. Purple dots indicate proteomes with five type III machinery components (full T3SS) and red dots are proteomes with fewer components. For each proteome, the evolutionary distance from the last common ancestor (X-axis), extracted from Lang et al.52, is plotted against the percentage of proteins predicted as effectors (Y-axis). While there is a correlation between the age and the quantities of effectors in proteomes of organisms with full T3SS (purple trend-line), the same appears not to be the case for organisms with less than five components. (b) Proteomes with full T3SS identified by source. Green dots are the percentage of proteins predicted as effectors by homology searches (PSI-BLAST) and blue dots are de novo predictions. While PSI-BLAST appears to consistently pick up ~1% of each proteome of all organisms (green horizontal trend-line), the effectors in Gram-negative bacteria diversify further over evolutionary distance, as indicated by the increase in the number of de novo predictions.

