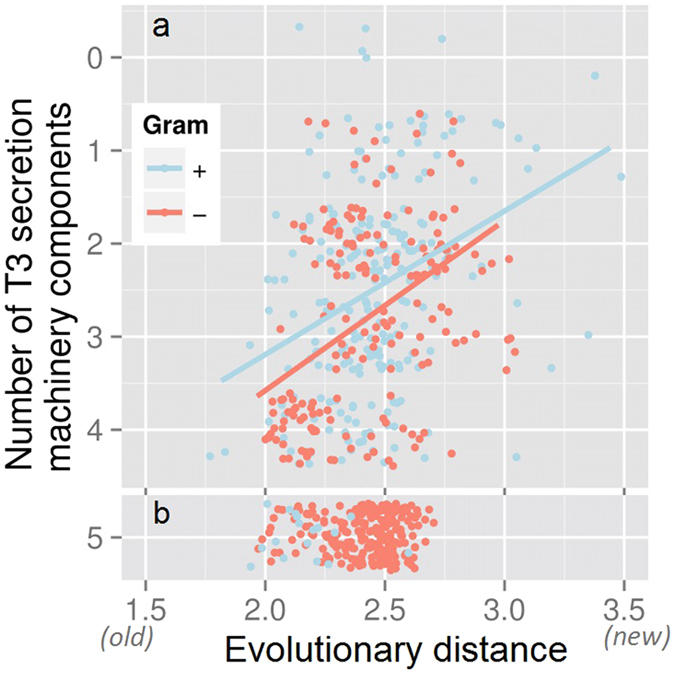
Figure 5. Loss of T3SS functionality differentiates Gram-positive and -negative bacteria.

274 Gram-positive bacteria (blue dots) and 588 Gram-negative bacteria (red dots) are screened for the number of conserved components of T3SS (max. 5 T3DB Ortholog clusters; Material and Methods) in their genomes (Y-axis) and plotted against the evolutionary distance from the most recent common ancestor (X-axis). Once the T3SS is lost (a), i.e. less than 5 components are present, further rate of loss of components is the same for all bacteria. The number of Gram-negative bacteria with the complete system (b), i.e. all 5 components present, however, remains constant across evolutionary time, while the number of Gram-positive bacteria declines.
