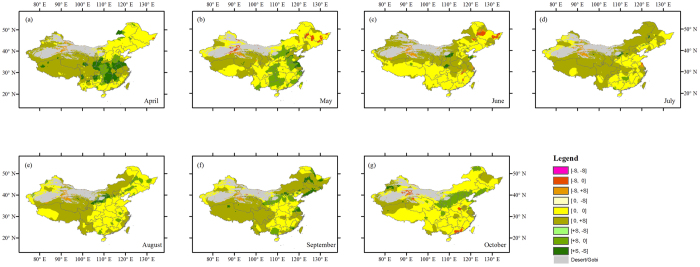
Figure 2.
Comparison of trends of NDVI and temperature for April–October (a–g). Statistically significant (the absolute value of MK test equal to or greater than 1.96) positive trends are denoted as + S, negative trends as −S and insignificant ones as 0. The first character in each pair right the color bar denotes NDVI trend and the second one denotes temperature trend. This figure was generated using ArcGIS 10.1 (http://www.esri.com/software/arcgis/).

