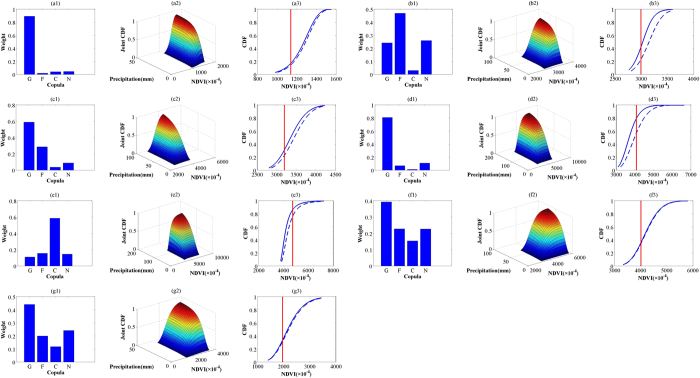
Figure 3.
Weight values of four copulas (left) (G, F, C, and N indicates Gumbel, Frank, Clayton, and Normal, respectively), joint CDF using the best-fitted copula (middle), and conditional CDF of NDVI under two precipitation scenarios: uP ≤ 20% (blue solid curves) and uP ≤ 60%(blue dashed curves), with the specific NDVI drought threshold ( ) shown as red lines (right), for April–October (a–g).

