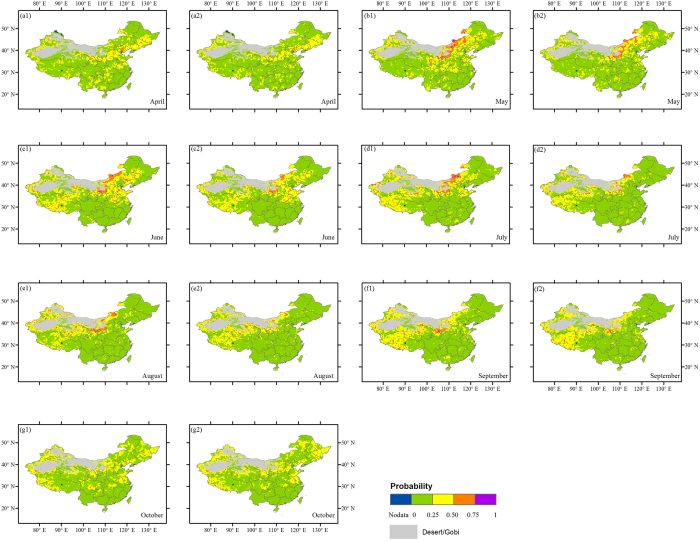
Figure 4.
Drought probability (risk) of vegetation for the particular NDVI threshold ( ) under uP ≤ 20% (1) and uP ≤ 60% (2) precipitation scenarios across China from April–October (a–g). The background is an administrative map of China. This figure was generated using ArcGIS 10.1 (http://www.esri.com/software/arcgis/).

