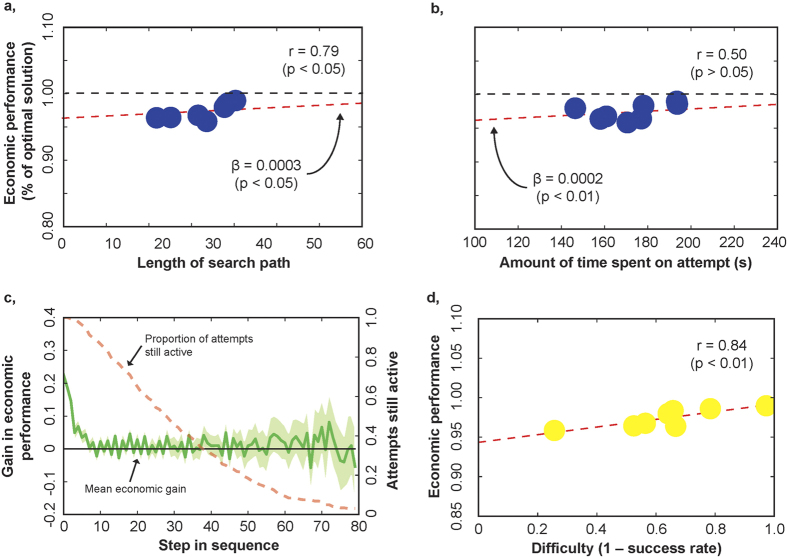
Figure 3. Economic Performance, Effort and Difficulty.
(a) Scatter plot of economic performance (value attained as percentage of optimal solution value) and effort measured as mean length of the search path across attempts of an instance (instance means). Black dashed line: 100%, red dashed line: main effect of path length, linear mixed model (LMM) with random effects on intercept for individual participants (Table S3 Model 3), r: Pearson correlation, β: coefficient estimate of main effect. (b) Scatter plot of economic performance and effort measured as mean amount of clock time spent across attempts of an instance (instance means). Red dashed line: main effect of path length, LMM with random effects on intercept for individual participants (Table S3 Model 4). (c) Mean marginal gain in economic performance across all attempts, per step in the search path. (d) Scatter plot of economic performance against difficulty (as revealed by mean success rate across attempts of an instance; inverted scale) (instance means).

