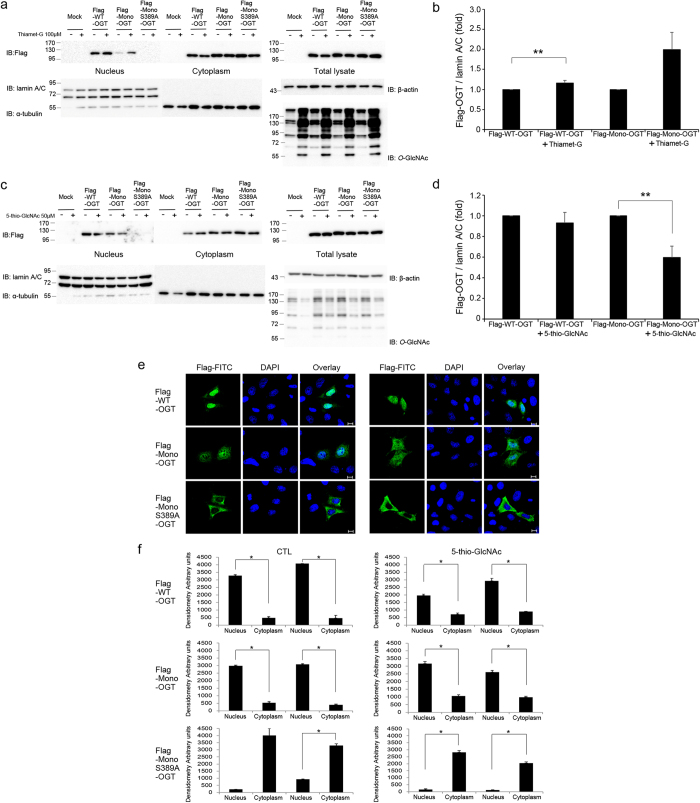
Figure 6. O-GlcNAcylation of Ser389 affects the nuclear localisation of OGT.
(a) HeLa cells were treated with Thiamet-G (100 μM, 4 h) and were then transfected with Flag-tagged WT-OGT, Mono-OGT or Mono-OGT S389A for 24 hours. Cell extracts were subjected to subcellular fractionation. Western blotting of aliquots of the fractions was performed with an α-Flag antibody to detect the OGT constructs, and with α-α-tubulin and α-lamin A/C antibodies as cytoplasmic and nuclear markers, respectively. Images of western blot immunoblotted with an α-Flag antibody, was stripped, and then re-immunoblotted with α-lamin A/C, α-α-tubulin and α-β-actin antibodies respectively. (b) The band intensities of nuclear imported Flag-OGT in (a) were quantified by densitometry and normalised to the laminA/C band intensity. **P < 0.05 (Student’s t-test), mean ± s.d. (c) HeLa cells were treated with 5-thio-GlcNAc (50 μM, 4 h) and were then transfected with Flag-tagged WT-OGT, Mono-OGT or Mono-OGT S389A for 24 hours. Cell extracts were subjected to subcellular fractionation as described in (a). (d) The band intensities of nuclear imported Flag-OGT in (c) were quantified by densitometry and normalised to the laminA/C band intensity. **P < 0.05 (Student’s t-test), mean ± s.d. (a,c) Full gel blots for the cropped blots (a,c) are in the supplementary Fig. 7. (b,d) Full gel blots for the statistics (b,d) are in the supplementary Fig. 8. (e) Immunofluorescence analysis confirmed the subcellular fractionation results shown in (b). HeLa cells were treated with 5-thio-GlcNAc (50 μM, 4 h) or untreated, and then transfected with Flag-tagged WT-OGT, Mono-OGT or Mono-OGT S389A. Thereafter, cells were fixed, stained with an α-Flag antibody (green) and DAPI (blue), and visualised. Scale bar, 10 μm. (f) The mean of densitometry readings in five separate locations within the nucleus was obtained and this was compared with the mean measurement of five separate locations within the cytoplasm of each cell. Data were quantified using MetaMorph software. Data show mean ± s.d.; n = 5 locations in the cell. *P < 0.01 (Student’s t-test). All data are representative of at least three independent experiments.

