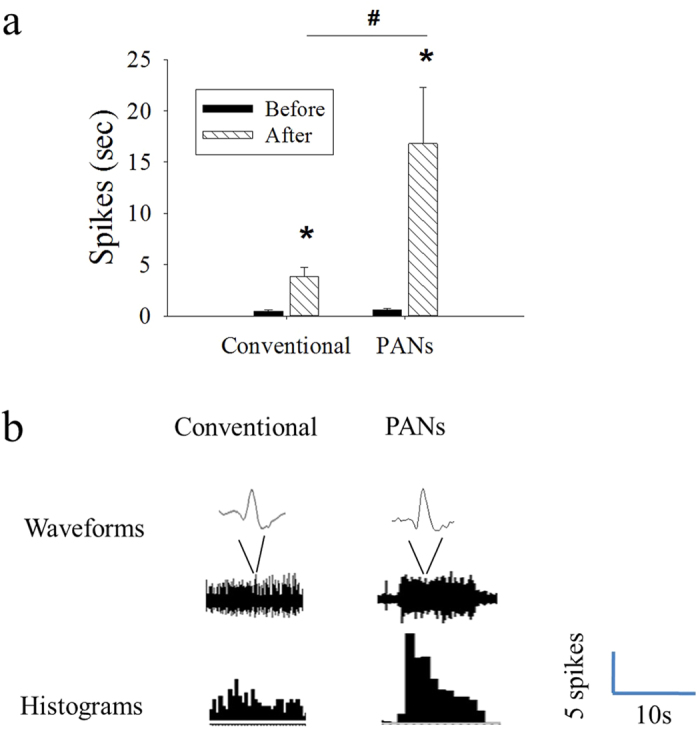
Figure 3.

(a) Conventional and PAN groups show increased neuronal activity to needle stimulation (after) compared to before stimulation (*p < 0.05). In addition, PAN group shows a significant increase in stimulation-induced neuronal activity compared to conventional group (#p < 0.05). (b) Real-time waveforms of activity (upper: single action potential shape; lower: waveforms of samples neurons) during in vivo spinal single dorsal horn neuron recording, with the resulting histogram of the neuronal activity (bottom row, 1 second bins). The data recording apparatus is illustrated in Supplementary Figure S2.
