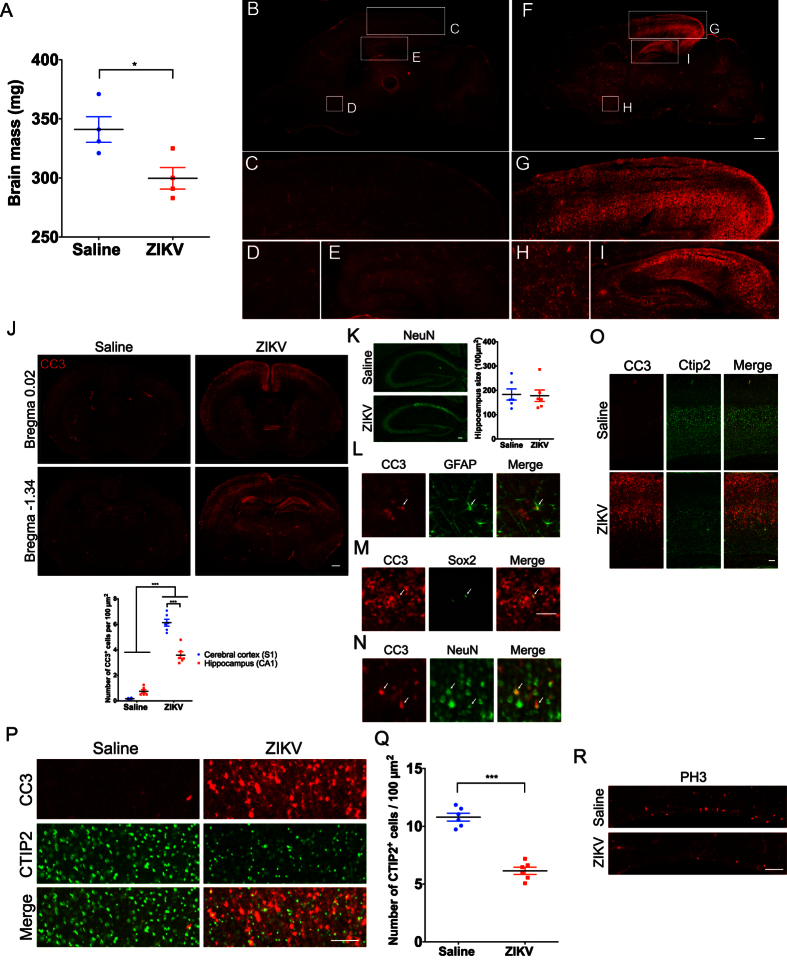
Figure 2. ZIKV infection results in decreased brain mass, non-uniform apoptosis, decreased CTIP2+ corticospinal neurons and depletion of proliferating cells in the ventricular zone.
Brains of mice injected intracranially with saline or ZIKV at P7 and collected 4dpi for immunohistochemistry. (A) Graph showing reduced brain mass in animals injected with ZIKV at P7 as compared to saline injected controls. Independent sample t-tests were used. *p < 0.05. N = 4 animals per group. (B,F) Sagittal images of saline (B) and ZIKV (F) injected wild type mouse brains immunostained with anti-cleaved caspase 3 (CC3). Scale bar: 500 μm. Lettered boxes (C-E and G-I) in these images are magnified in corresponding panels below: occipital cortex (C,G), striatum (D,H), and hippocampus (E,I). ZIKV infected mouse brain showed widespread apoptosis, with occipital cortex and hippocampus showing particularly high levels of CC3+ cells. (J) Coronal images of saline and ZIKV injected wild type mouse brains stained with anti-CC3. Scale bar: 500 μm. CC3+ cells were enriched in upper layer II and layer V of the cerebral cortex, and CA1 regions of the hippocampus. Quantification of CC3+ cells in the primary somatosensory cortex (S1) and CA1 regions of the hippocampus. Two-way ANOVA and Tukey’s post hoc tests were used. F(1,20) = 59.58, p < 0.001 (interaction), F(1,20) = 470.4, p < 0.001 (treatment), and F(1,20) = 23.45, p < 0.001 (brain regions). ***p < 0.001. N = 6 animals per group. (K) Images showing NeuN staining (green) in the hippocampus of saline and ZIKV infected mouse brains. The size of the hippocampus is similar between saline and ZIKV injected mice. Independent sample t-tests were used. N = 6 animals per group. Scale bar: 100 μm. (L–N) Double immunostaining of anti-CC3 (red) with anti-GFAP (astrocyte marker, green) (L), anti-Sox2 (neural progenitor cell marker, green) (M), and anti-NeuN (neuronal marker, green) (N) in ZIKV infected mouse brains. Arrows indicate double labeled cells. Scale bar: 50 μm. (O) Images showing anti-CC3 (red) and anti-CTIP2 (green) staining in the motor cortex of saline and ZIKV injected wild type mice. Scale bar: 100 μm. (P) Images showing anti-CC3 (red) and anti-CTIP2 (green) staining in layer V of the motor cortex in saline and ZIKV injected wild type mice. Scale bar: 100 μm. Some, but not all, CC3+ cells were co-labeled with anti-CTIP2, a marker for subcortical-projecting neurons in the layer V cortex. ZIKV infected mice displayed reduced density of CTIP2+ neurons. Images are representative of 5-6 sections per animals from 6 animals per group (saline and ZIKV). (Q) Quantification of CTIP2+ cells in saline or ZIKV injected mouse brains. Independent sample t-tests were used. ***p < 0.001. N = 6 animals per group. (R) Images showing anti-phospho-histone H3 (PH3) staining in the ventricular zone of saline and ZIKV injected wild type mice. ZIKV infected mice displayed a reduced number of PH3+ cells. Scale bar: 100 μm.

