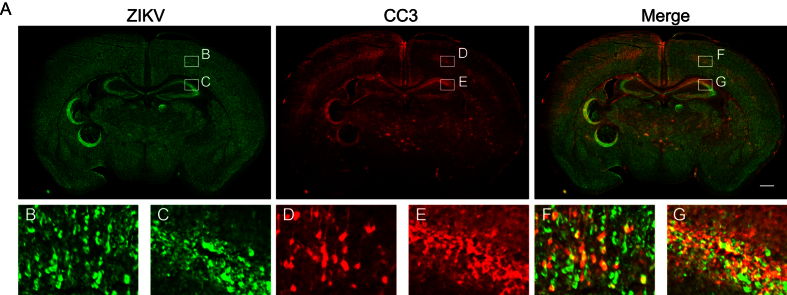
Figure 3. Partial overlap between cleaved caspase 3 and ZIKV immunolabeled brain cells.
Brains of mice injected intracranially with saline or ZIKV at P7 and collected 4dpi for immunohistochemistry. Anti-CC3 staining is shown in red, and anti-ZIKV is shown in green. (A) Coronal image of a ZIKV infected mouse brain. Scale bar: 500 μm. Lettered boxes (B–G) in these images are magnified in corresponding panels below: cortex (B,D,F), and hippocampus (C,E,G). Some, but not all, CC3+ cells were positive for ZIKV. Images are representative of 5-6 sections per animals from 6 animals.

