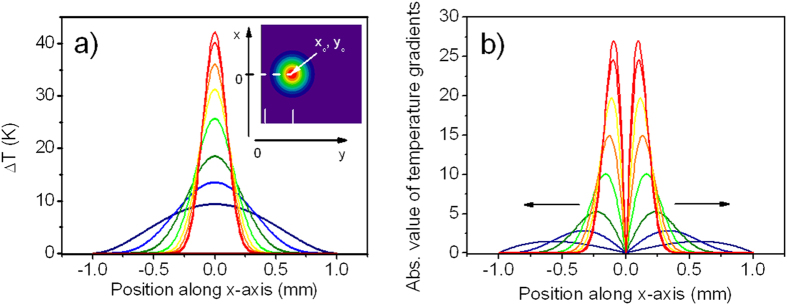
Figure 1. Temperature gradients due to laser heating.
(a) The modelling of temperature distribution due to heat diffusion at different distances from the laser spot situated at (xc, yc) within an absorbing layer, color lines correspond to ΔT scale, which is exemplary but laser beam waist is real; (b) the absolute value of temperature gradients  derived at the same distances from the source as in (a). Arrows show direction of particle movements at the interface due to temperature gradient field.

