
Figure 5. Scatter plot of the NADH phasor FLIM showing average g and s phasor values for each animals eye disc ROI (N) for total of 15 animals and a total of N = 149 ROI measurements.
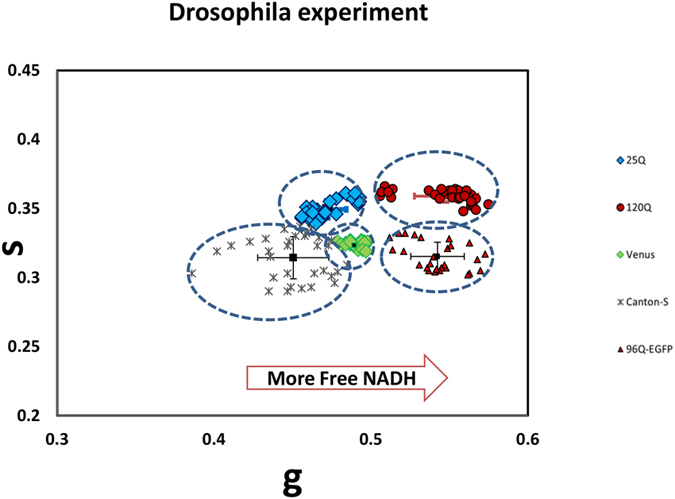
The blue diamond refers to 25Q (N = 30), green diamond Venus control (N = 28), gray asterisk wildtype with no HTT (Canton-S, N = 32).Tissue with expanded expression 120Q (N = 32, in red circle) and 96Q-EGFP (N = 27, in red triangles) indicates shortening of the lifetime towards the glycolytic state, shifted to the right.