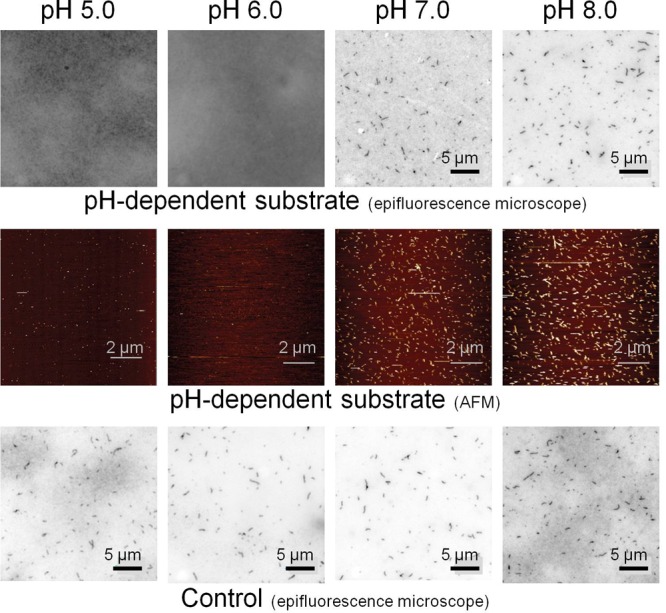
Figure 3.

pH-dependent self-assembly of DNA tiles. (Top) The upstream, pH-dependent DNA circuit coupled with a downstream tile self-assembly process (Figure 1) allows to control DNA tile self-assembly with pH. At acidic pHs (pH 5.0 and 6.0) no formation of assemblies is observed with optical fluorescence microscopy. By increasing the pH of the solution (pH 7.0 and 8.0) we achieve evident formation of DNA lattices. (Center) pH-dependent lattices were also imaged with atomic force microscopy (AFM). (Bottom) A control experiment using a pH-independent substrate (unable to form a pH-dependent triplex structure (Figure SI5)) leads to pH-independent assembly of DNA tiles. All the experiments shown here and in Figure 4 were performed using the following concentrations of reagents: protected tile (PT), 200 nM; fuel (F), 440 nM; pH-dependent substrate or control substrate, 220 nM; and catalyst (C), 20 nM. The assembly was achieved in TAE 1x buffer + 15 mM MgCl2, at 25 °C with the pH adjusted using small aliquots of HCl (1 M) and NaOH (1 M). For all the fluorescence microscopy experiments, a cy3-labeled tile central strand (t4, see SI) was used to detect nanotubes formation. AFM images of the pre-adsorbed nanostructures on freshly cleaved mica (see SI) were obtained with AC mode in TAE 1x buffer + 15 mM MgCl2 buffer, with 1 Hz scan rate, 256 pixel × 256 pixel image definition and processed with second-rder flattening.
