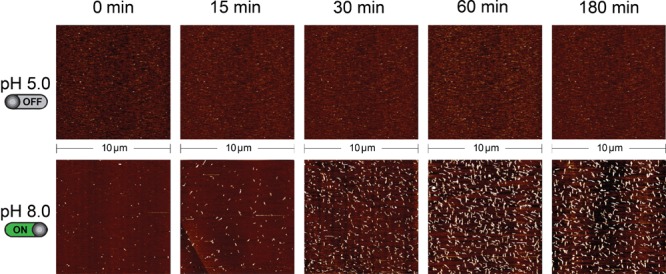
Figure 4.

Kinetics of pH-dependent self-assembly of DNA tiles. The self-assembly of DNA tiles was followed by AFM images at different time intervals. No tile assembly is observed within the time frame of the experiment at pH 5.0. In contrast, at basic pH (pH 8.0), DNA lattices can be clearly observed just 15 min after catalyst addition. See Figure 3 caption for experimental details.
