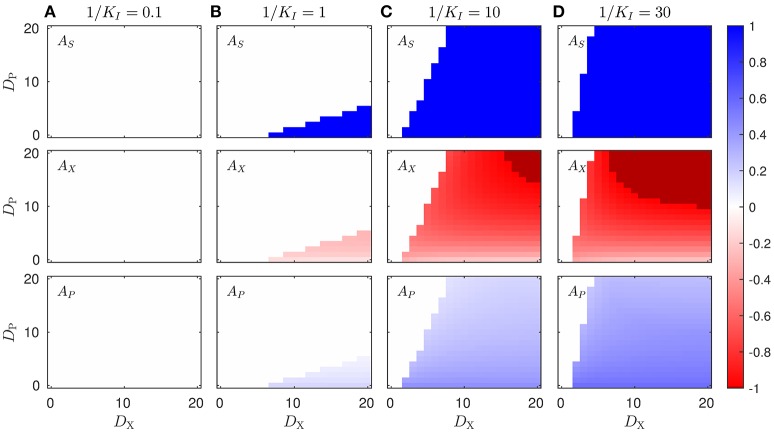
Figure 2.
Enzyme asymmetries Aα for optimal proteome allocation solutions obtained in different scenarios. The figure shows the optimal solution in terms of the enzyme asymmetries as a function the diffusion constants DX and DP, and for different values of the inhibition constant, in the case of uncompetitive inhibition of P on the enzyme ES (see Equation 1), Subplots on each column, labeled (A–D) correspond to the solution obtained for a different values of 1/KI, whereas rows represents the different enzymes of the pathway. The darker color in the 1/KI = 10 and 1/KI = 30 subplot columns highlight the region in which [ES, 2] = [EX, 1] = 0, and the pathway is completely split between the two cell types. The color scale corresponds to the asymmetry value of the different enzymes.

