Figure 3.
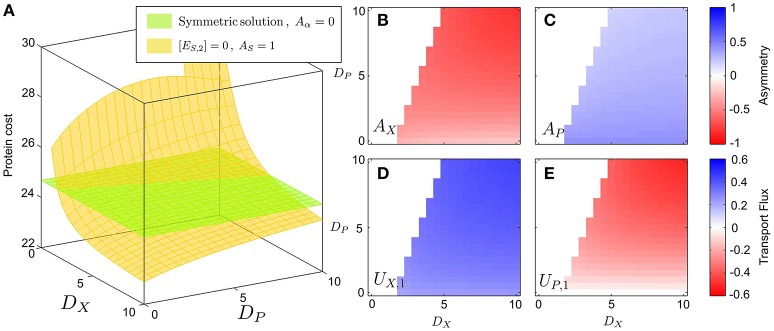
Optimal solutions (minimum proteins) in the case of uncompetitive inhibition. The figure shows protein costs plotted as a function of DX and DP for a fixed value of the inhibition 1/KI = 10. (A) The cost function (that is, the total protein cost) is shown in the z-axis; the green surface, corresponding to the symmetric solution, is obtained by imposing that the two cells have identical enzyme allocation, while the yellow one is obtained imposing that one of the two cells lacks the ES enzyme. (B) proteome asymmetry of the EX enzyme; (C) Proteome asymmetry for the EP enzyme; (D) Optimal transport flux UX, 1 of the X metabolite from cell 1 to cell 2; (E) Optimal transport flux UP, 1 of the P metabolite from cell 1 to cell 2 (the negative value of the flux means that P is actually shuttled from cell 2 to cell 1). The color scale of subplots (B,C) and (D,E), corresponds to the asymmetry value of the different enzymes and the sense of the transportation fluxes, respectively.

