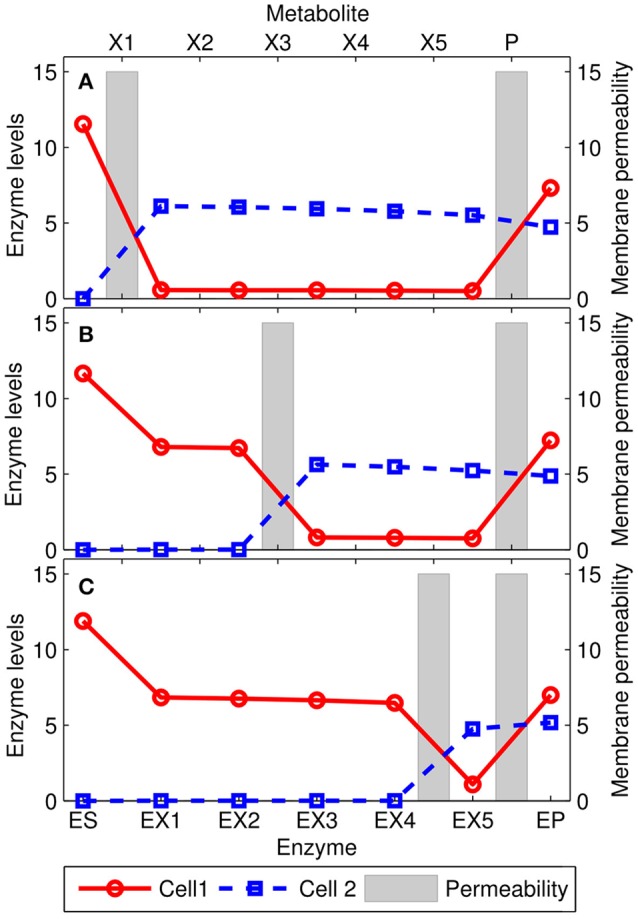
Figure 4.

Solutions for the extended model with 5 intermediate metabolites X1, …, X5. The points represent the optimal enzyme levels of the two cells, while the gray bars are the membrane permeabilities (Di) for the intermediate metabolites. In each panel, the P metabolite and one of the intermediate metabolites Xi [i = 1, 3, and 5 in panels (A–C), respectively] is allowed to permeate through the membrane (D = 15), while all others were not (D = 10−3). In these conditions, the pathway is split in correspondence of the permeable intermediate metabolite. Other settings: Keq = 4/3 for all reversible reactions (all but the one catalyzed by the EP enzyme). Inhibition constant: KI = 1/10; the concentration of [S] = 20.
