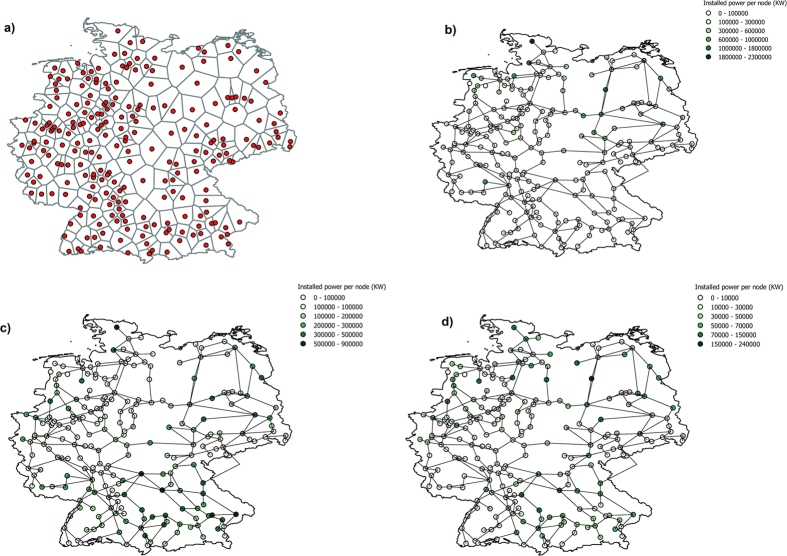
Figure 1.
Four maps representing the Voronoi tessellation of the German power system, where red nodes indicate transmission nodes (a), the amount of installed wind (b), photovoltaics PV (c) and biomass generation (d) in Germany, for each node of the 380 KV grid. The figure has been produced using the QGIS software53.

