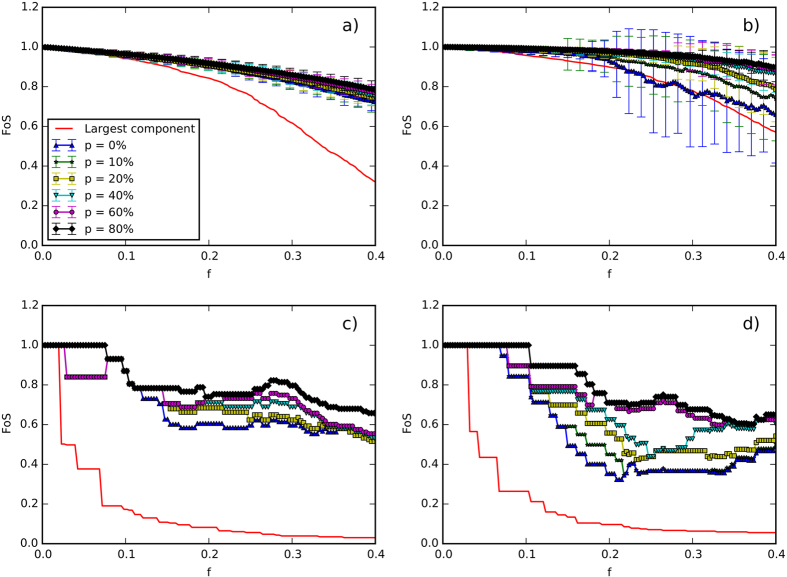
Figure 2. Fraction of nodes FoS in self-sustaining islands versus the percentage f of removed links.
Upper panels: random removal of links; lower panels: link removal based on betweenness centrality (BC). Left panels: German grid; right panels: Italian grid. We consider different levels of renewable energy sources p (i.e. the percentage of renewable power with respect to conventional power): p = 0% (blue upper triangles), p = 10% (green stars), p = 20% (yellow squares), p = 40% (turquoise lower triangles), p = 60% (purple circles) and p = 80% (black diamonds); the actual amount of renewable sources in Italy and Germany is ~20%. In balancing the power of the islands, the renewable power was kept constant, while only the conventional generation capacity was adapted to balance the power request. The red curves in all panels show the fraction P∞ of nodes in the largest component (i.e. the largest fragment of the network after link removal). For further explanations see the text.

