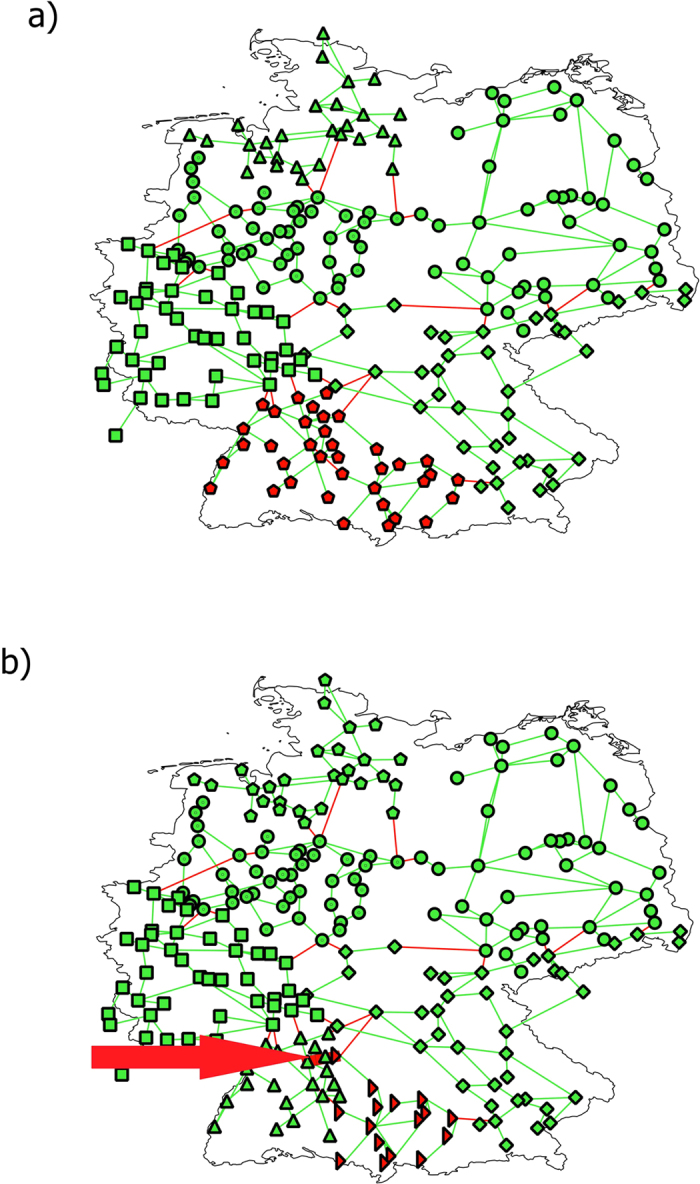
Figure 4. Example of the Braess paradox in case of islanding upon link removals.

Upper panel and lower panel show the German grid after removing 23 (a) and 24 (b) transmission lines according to their betweenness centrality. The different islands of the grids are indicated via different symbols; working nodes and links are green, inactive nodes and removed links are red. The removal of a single link, the 24th one, pointed at with the red arrow, increases the number of working nodes by splitting the non-working cluster in the south-west of (a) into one working (green symbols) and one non-working (red symbols) in the south west of (b). Only 80% RES in the non-working cluster of (b) would allow the cluster to become a self-sustaining island. The figure has been produced using the QGIS software53.
